

Installing BuildPiper on Kubernetes #
This guide walks you through setting up BuildPiper (BP) on a Kubernetes cluster. It covers the configuration and deployment process for running BuildPiper as a non-root user. Follow the steps to ensure a secure, reliable, and properly configured deployment.
BP is installed with a Helm chart prepared by the BP team from the values you provide. Once applied, BP runs as a set of pods in a dedicated namespace on your cluster.
Looking for the VM-based setup instead? See Installing BuildPiper, which covers installing BP with Docker Compose on a virtual machine.
1. Prerequisites #
1.1 Supported OS and cluster specs #
| Requirement | Value |
|---|---|
| Supported OS | Ubuntu 18, 20, 22, or RHEL 9 |
| K8s cluster specs | 1 master and 2 worker nodes, 8 cores and 16 GB each |
| Driver prerequisite | EFS-based CSI drivers must be set up in the EKS cluster |
Note:The EFS driver above is specific to AWS. On other clouds or on-premise, use an equivalent of the EFS-based CSI driver, such as Longhorn.
1.2 Supported Kubernetes versions #
| Kubernetes version | Status |
|---|---|
| v1.25 – v1.35 | Supported |
1.3 Managed Redis and MySQL #
Please make sure that managed Redis and MySQL are available to be used as part of the setup
| Component | Command to check the version | Supported version |
|---|---|---|
| DB (MySQL) | mysql --version |
MySQL Ver 8.0.45 |
| Redis | redis-server --version |
Redis server v=8.2.2 |
MySQL default configuration #
Apply these settings to the managed MySQL instance:
-- Disable general log
SET GLOBAL general_log = 0;

-- Set log file path
SET GLOBAL general_log_file = '/var/lib/mysql/general.log';

-- Set TLS version
SET GLOBAL tls_version = 'TLSv1.2';

-- Set max connections
SET GLOBAL max_connections = 400;

-- Set transaction isolation level
SET GLOBAL transaction_isolation = 'READ-COMMITTED';

-- Set sort buffer size (8 MB)
SET GLOBAL sort_buffer_size = 8*1024*1024;

-- Set wait timeout (seconds)
SET GLOBAL wait_timeout = 86400;

-- Set interactive timeout (seconds)
SET GLOBAL interactive_timeout = 86400;
Validation SQL #
Run this to confirm the settings were applied:
SHOW VARIABLES
WHERE Variable_name IN (
  'general_log',
  'general_log_file',
  'tls_version',
  'max_connections',
  'transaction_isolation',
  'sort_buffer_size',
  'wait_timeout',
  'interactive_timeout',
  'default_authentication_plugin'
);
Redis configuration #
CONFIG SET appendonly yes1.4 Filebeat and Elasticsearch logging (optional) #
If the setup needs Filebeat-based logging, the client must provide these details before the Helm chart is configured.
| Component | Command to check | Supported version |
|---|---|---|
| Filebeat | filebeat version --strict |
Elastic Filebeat v8.x |
| Elasticsearch | curl -k -u <user>:<pass> https://<ES_ENDPOINT>/ |
Elasticsearch v8.x (managed or self-hosted) |
Required client inputs #
update these values in the Helm values file before deployment:
| Parameter | Description | Example |
|---|---|---|
| filebeatDeployment.elasticsearch.hosts | Endpoint URL of the Elasticsearch cluster | https://elasticsearch-master.logging.svc.cluster.local:9200 |
| filebeatDeployment.elasticsearch.username | Username for ES authentication | elastic |
| filebeatDeployment.elasticsearch.password | Password for ES authentication | ******** |
| filebeatDeployment.elasticsearch.sslVerificationMode | SSL verification mode | none or full |
| filebeatDeployment.input.path | Log file path to collect | /home/buildpiper/.log/buildpiper/**/*.log |
| filebeatSidecar.enabled | Enable or disable the Filebeat sidecar per container | true or false |
| filebeatSidecar.app | Application name for the sidecar | frontend, publicapi |
Deployment mode options #
| Mode | How it works | What to set |
|---|---|---|
| Filebeat Deployment (Centralized) | A single Filebeat pod collects logs from all containers | filebeatDeployment.enabled: true and filebeatSidecar.enabled: false |
| Filebeat Sidecar (Distributed) | Filebeat runs as a sidecar container alongside each BP application pod | filebeatSidecar.enabled: true for each component: frontend, publicapi, scheduledapi, deployapi, bp_agent |
Note: Confirm with the client which deployment mode they prefer, and update the values file accordingly.
2. Setup procedure #
| Step | Who does it | What happens |
|---|---|---|
| Step 1 | Client | Fill in the values collection sheet provided by the BP team |
| Step 2 | BP team | Use those values to update the Helm chart’s values file |
| Step 2.1 | BP team | If Filebeat logging is required, update values.yaml or loadbalancer-setup-values.yaml with the client’s Elasticsearch credentials and deployment mode |
| Step 3 | BP team | E-mail the zipped Helm chart and values file |
| Step 4 | Admin team | Apply the updated Helm chart received over e-mail |
Example: Filebeat Deployment (Centralized) #
filebeatDeployment:
  enabled: true
  elasticsearch:
    hosts:
      - "https://elasticsearch-master.logging.svc.cluster.local:9200"
    username: elastic
    password: "0000000000000"
    sslVerificationMode: none
    index: "bp-app-logs-%{+yyyy.MM.dd}"
  input:
    id: bp-app-logs
    path: /home/buildpiper/.log/buildpiper/**/*.log
    app: bp-on-k8s
  resources:
    limits:
      cpu: 200m
      memory: 150Mi
    requests:
      cpu: 50m
      memory: 50Mi
Example: Filebeat Sidecar (per container) #
filebeatSidecar:
  enabled: true
  app: frontend
  input:
    id: frontend-logs
    paths:
      - /home/buildpiper/.log/buildpiper/**/*.log
3. Install BP with Helm #
Three values are needed before running the install command:
| Value | What it is |
|---|---|
| {helm files directory path} | The directory where the BP Helm files were unzipped |
| {specify_namespace where bp will be setup} | The namespace for BP. A dedicated namespace is recommended |
| {filebeat_mode_configuration} | Set filebeatDeployment.enabled or filebeatSidecar.enabled in the values file, based on the deployment mode |
Step 1: Export the kube config file #
export KUBECONFIG="cluster config path"Step 2: Run the Helm install command #
helm install bp {helm files directory path}
  --set optimizedRun.firstTime=true
  --set optimizedRun.withPermission=true
  --namespace {specify_namespace where bp will be setup}
  -f {helm files directory path}/values.yaml
  -f {helm files directory path}/loadbalancer-setup-values.yaml
  --wait
Note: Filebeat configuration is managed through the values file, not through Helm –set flags. Make sure all Filebeat parameters are correctly set in loadbalancer-setup-values.yaml before running this command.
4. Upgrade BP with Helm #
Step 1: Export the kube config file #
export KUBECONFIG="cluster config path"Step 2: Run the Helm upgrade command #
helm upgrade bp {helm files directory path}
  --set optimizedRun.firstTime=true
  --set optimizedRun.withPermission=true
  --set filebeat.mode={sidecar|deployment}
  --namespace {specify_namespace where bp will be setup}
  -f {helm files directory path}/values.yaml
  -f {helm files directory path}/loadbalancer-setup-values.yaml
  --wait
5. Verify the setup #
Step 1: Check that all BP pods are running #
kubectl get pods -n {namespace where BP is installed}All pods should be in the Running state and Ready.
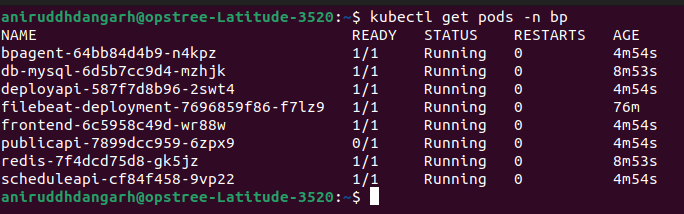
BP pods running in the bp namespace
Note: In sidecar mode, application pods show 2/2 Ready, the main container plus the Filebeat sidecar. In deployment mode, a separate filebeat pod appears instead.
Step 2: Check service and public endpoint access (optional) #
Fetch the publicapi endpoint ports #
kubectl get svc -n {namespace where BP is installed} | grep NodePortGet the master node IP #
kubectl get nodes -o wideCheck connectivity to the service ports #
telnet <MASTER_NODE_IP> <SERVICE_PORT>Check the publicapi health status #
curl <NODE_IP>:30706/api/v1/default/health/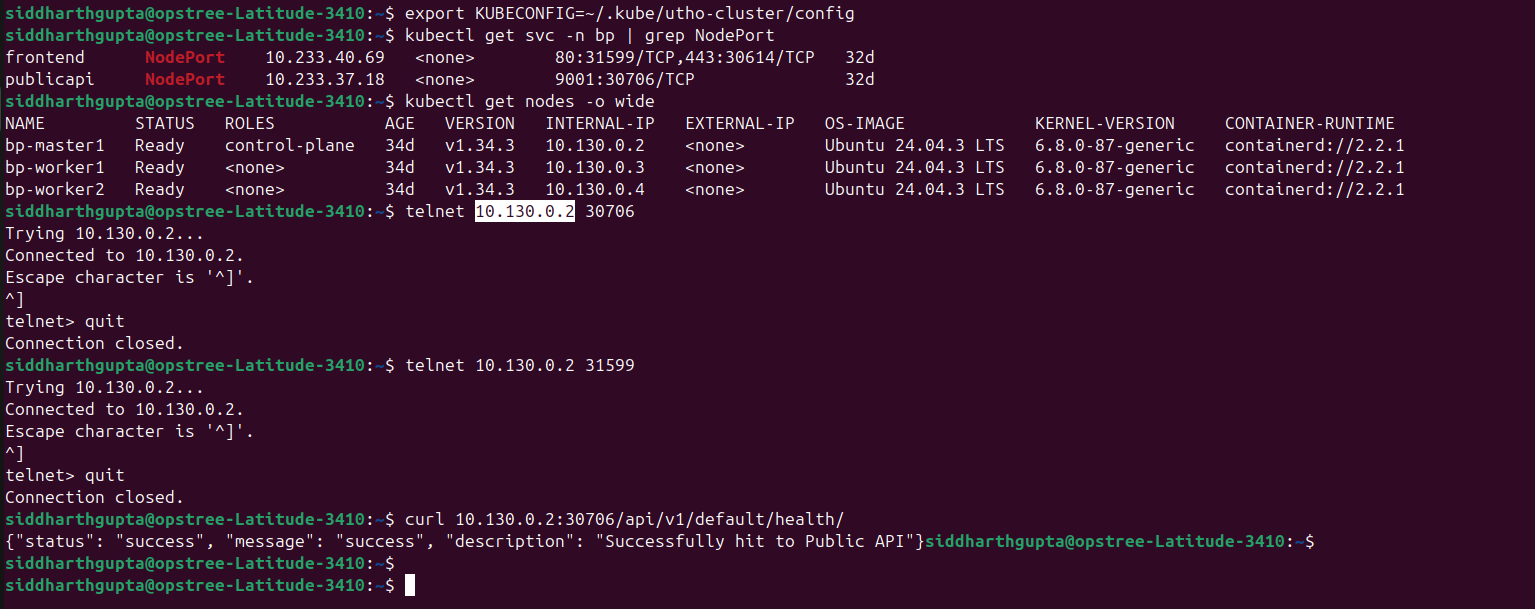
Checking services, nodes and the publicapi health endpoint
Note: The health URL returns a success status when the publicapi component is operational.
Step 3: Fetch component logs #
This works for any BuildPiper component.
List the pods to get the component pod name #
kubectl get pods -n {namespace where BP is installed}Fetch the logs using that pod name #
kubectl logs -f {buildpiper component pod name} -n {namespace where BP is installed}For example:
kubectl logs -f publicapi-xxxxxx -n bp
kubectl logs -f bpagent-xxxxxx -n bp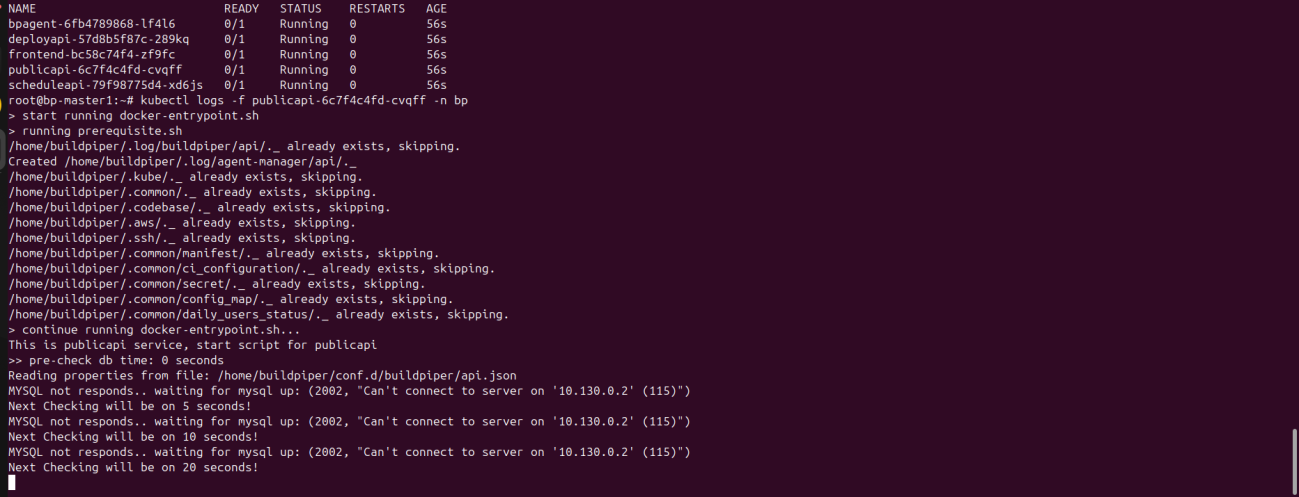
publicapi pod logs during startup
Step 4: Validate Filebeat logging #
This step applies only when Filebeat logging is enabled.
Check that the Filebeat pod or sidecar container is running #
kubectl get pods -n {namespace where BP is installed}| Mode | What to look for |
|---|---|
| Sidecar mode | Each BP application pod (publicapi, scheduledapi, deployapi, frontend, bp_agent) shows 2/2 containers Ready |
| Deployment mode | A dedicated filebeat pod is in the Running state |
Check Filebeat connectivity to Elasticsearch #
kubectl logs -f {filebeat-pod-or-sidecar-container-name} -n {namespace where BP is installed}Look for these messages in the log:
| Message | What it means |
|---|---|
| Connection to Elasticsearch established | Success |
| connection refused or x509: certificate signed by unknown authority | A network or TLS issue |
Check that logs are visible in Elasticsearch #
Run this from a machine with access to Elasticsearch:
curl -k -u <username>:<password> https://<ES_ENDPOINT>/_cat/indices?vThe BP application log indices and data streams should be visible and receiving data.
Fetch Filebeat logs directly #
# List all pods to get the Filebeat pod name
kubectl get pods -n {namespace where BP is installed}

# Fetch the Filebeat logs using that pod name
kubectl logs -f {filebeat-pod-name} -n {namespace where BP is installed}
For sidecar mode:
kubectl logs -f {application-pod-name} -n {namespace where BP is installed} --container filebeatFor example:
kubectl logs -f publicapi-xxxxxx -n bp --container filebeat
kubectl logs -f frontend-xxxxxx -n bp --container filebeat
6. Load the environment master data #
For a fresh setup, run this once the publicapi component is up and operational:
python manage.py loaddata api/settings/metadata/environment_master.json7. Stable tags #
The Sample tags for BP on Kubernetes:
| Component | Image |
|---|---|
| bpagent | registry.buildpiper.in/okts/buildpiper-agent:vindh_2.0.0_GA_hotfix8_p1-airtel-k8s |
| deployapi | registry.buildpiper.in/okts/deploy_api:vindh_2.0.0_GA_hotfix8_p1 |
| frontend | registry.buildpiper.in/okts/front_end:vindh_2.0.0_GA_hotfix8_p4 |
| publicapi | registry.buildpiper.in/okts/public_api:vindh_2.0.0_GA_Hotfix8_P10 |
| scheduleapi | registry.buildpiper.in/okts/public_api:vindh_2.0.0_GA_Hotfix8_P10 |
Note: Always confirm the current stable tags before installing or upgrading.