

Dora Metrics Guide #
What Are DORA Metrics? #
DORA (DevOps Research and Assessment) metrics are a set of key performance indicators used to evaluate software delivery performance and operational stability. They help engineering teams understand how efficiently they deliver software changes, how quickly they respond to failures, and where improvements can be made in their software delivery processes.
In BuildPiper’s Maturity Insights, the DORA Metrics group provides visibility into delivery performance at the service and application levels. It helps teams track performance trends, identify bottlenecks, and assess improvements over time using the metrics and visualizations available in the dashboard.
This guide explains the metric cards, the graphs on the dashboard, the Application Metric Table and service-level metrics. Each metric has its own guide, which explains how it is calculated and how to read its graphs:
| Guide | What it covers |
|---|---|
| Deployment Frequency | How deployments are counted, how thresholds are scaled, and its trend, thresholds, distribution, top and weakest applications, and Application Release Activity. |
| Lead Time to Change | How lead time is measured and averaged, and its trend, thresholds, distribution, top and weakest applications, and Benchmarks. |
| Change Failure Rate | How failed changes are identified, and its trend, thresholds, distribution, top applications, and Contributors. |
Note: For how to open the dashboard and choose a date range, see the Maturity Insights Overview. For how to connect BuildPiper to Maturity Insights and configure the Dora Metrics thresholds, see “Configuring Dora Metrics” at the end of this guide.
Metric cards #

What it shows: One card for each Dora metric, with its value for the selected period and its maturity level badge (Elite, High, Medium or Low). Hover over the ⓘ icon on a card to see what the metric measures.
| Card | What it measures | Value shown | Better when |
|---|---|---|---|
| Deployment Frequency | How often successful releases were completed during the selected period. More frequent releases generally indicate a faster ability to deliver improvements and fixes. | Number of deployments | Higher |
| Lead Time to Change | The time from the first associated commit to successful production deployment. Lower lead time indicates faster delivery. | Average lead time | Lower |
| Change Failure Rate | The percentage of valid production deployments that were followed by a hotfix or rollback. A lower rate indicates more reliable releases. | Percentage, with the total number of failures | Lower |
The selected card is highlighted with a blue bar along the top. The metric graphs below show details for that metric, and clicking another card switches the graphs to it.
Example: Deployment Frequency is 69 deployments, rated Low. Lead Time to Change is 7d 22h, rated Elite. Change Failure Rate is 2.9% (2 total failures), also Elite. The team releases reliably and quickly, but not often enough.
Use it to: See at a glance which metrics are strong and which need work.
Metric graphs #
Below the metric cards on the DORA Metrics dashboard, a series of graphs provides a detailed view of the selected metric. These visualizations help users understand metric trends, evaluate performance against defined thresholds, and compare application-level results. Hover over the ⓘ icon next to a graph’s title to see a short description, and hover over a bar, point or segment to see its values.
The available graphs and visualizations include:
• Metric Trend (named after the selected metric, for example Deployment Frequency Trend): Shows how the selected metric changes over time across the selected period.
• Thresholds Legend: Shows the value needed to reach each maturity level for the selected metric and period, and how the metric is measured. Click How it Works to see how the metric is calculated and how the level is decided.
• Metal Rating Distribution: Displays the percentage and number of applications in each maturity level (Elite, High, Medium and Low) for the selected metric.
• Top Performing Applications: Highlights the applications with the strongest performance. Only applications rated Elite or High are included, and applications with no scan data are left out.
• Need Attention Applications: Identifies the applications that may require improvement, with their values and maturity levels. Only applications rated Medium or Low are included, and applications with no scan data are left out.
• Benchmarks: Shows typical values for the metric using percentiles (P50, P75 and P95).
• Contributors: Shows which applications contribute most to the metric.
• Application Release Activity: Shows how regularly each application released over time.
The exact set of graphs depends on the selected metric. For example, Application Release Activity appears for Deployment Frequency, Lead Time to Change Benchmarks for Lead Time to Change, and Change Failure Rate Contributors for Change Failure Rate. For each metric’s graphs, with screenshots and examples, see its own guide: Deployment Frequency, Lead Time to Change or Change Failure Rate.
Application Metric Table #
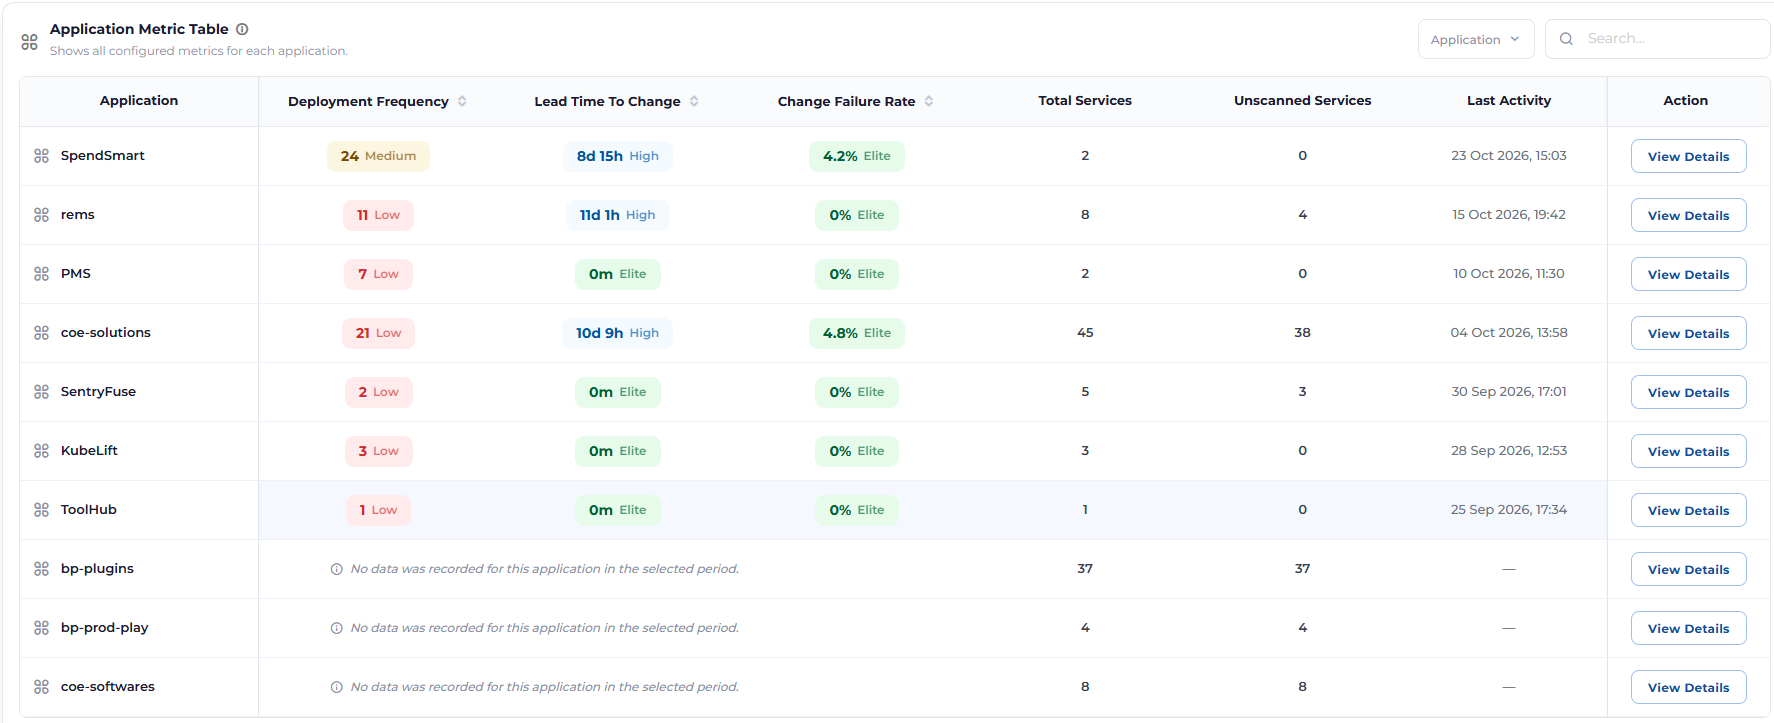
What it shows: An application-level view of every metric in the selected metric group. Values, maturity levels, related counts and latest activity are calculated using the selected filters and date range.
| Column | Meaning |
|---|---|
| Application | Application name. |
| Deployment Frequency, Lead Time To Change, Change Failure Rate | The value and maturity level for each metric in the metric group. Click the arrows next to a heading to sort. |
| Total Services | Number of services in the application. |
| Unscanned Services | Services with no scan data in the selected period. |
| Last Activity | Date and time of the most recent activity. |
| Action | Click View Details to open the full Dora Metrics view for that application (see below). |
If an application has no data for the selected period, its row shows “No data was recorded for this application in the selected period.” Use the Application drop-down and Search… box above the table to find what you need.
Example: SpendSmart is rated Medium for Deployment Frequency (24), High for Lead Time to Change (8d 15h) and Elite for Change Failure Rate (4.2%), with both of its services scanned. coe-solutions has 45 services, but 38 of them are unscanned, so its scores reflect only a few services. bp-plugins has no data at all: all 37 of its services are unscanned.
Use it to: Compare applications across every metric at once and find coverage gaps.
Viewing a single application #
Click View Details next to an application to open its own Dora Metrics view. It works like the organization-wide dashboard, but shows only that application, and breaks its results down by service instead of by application.
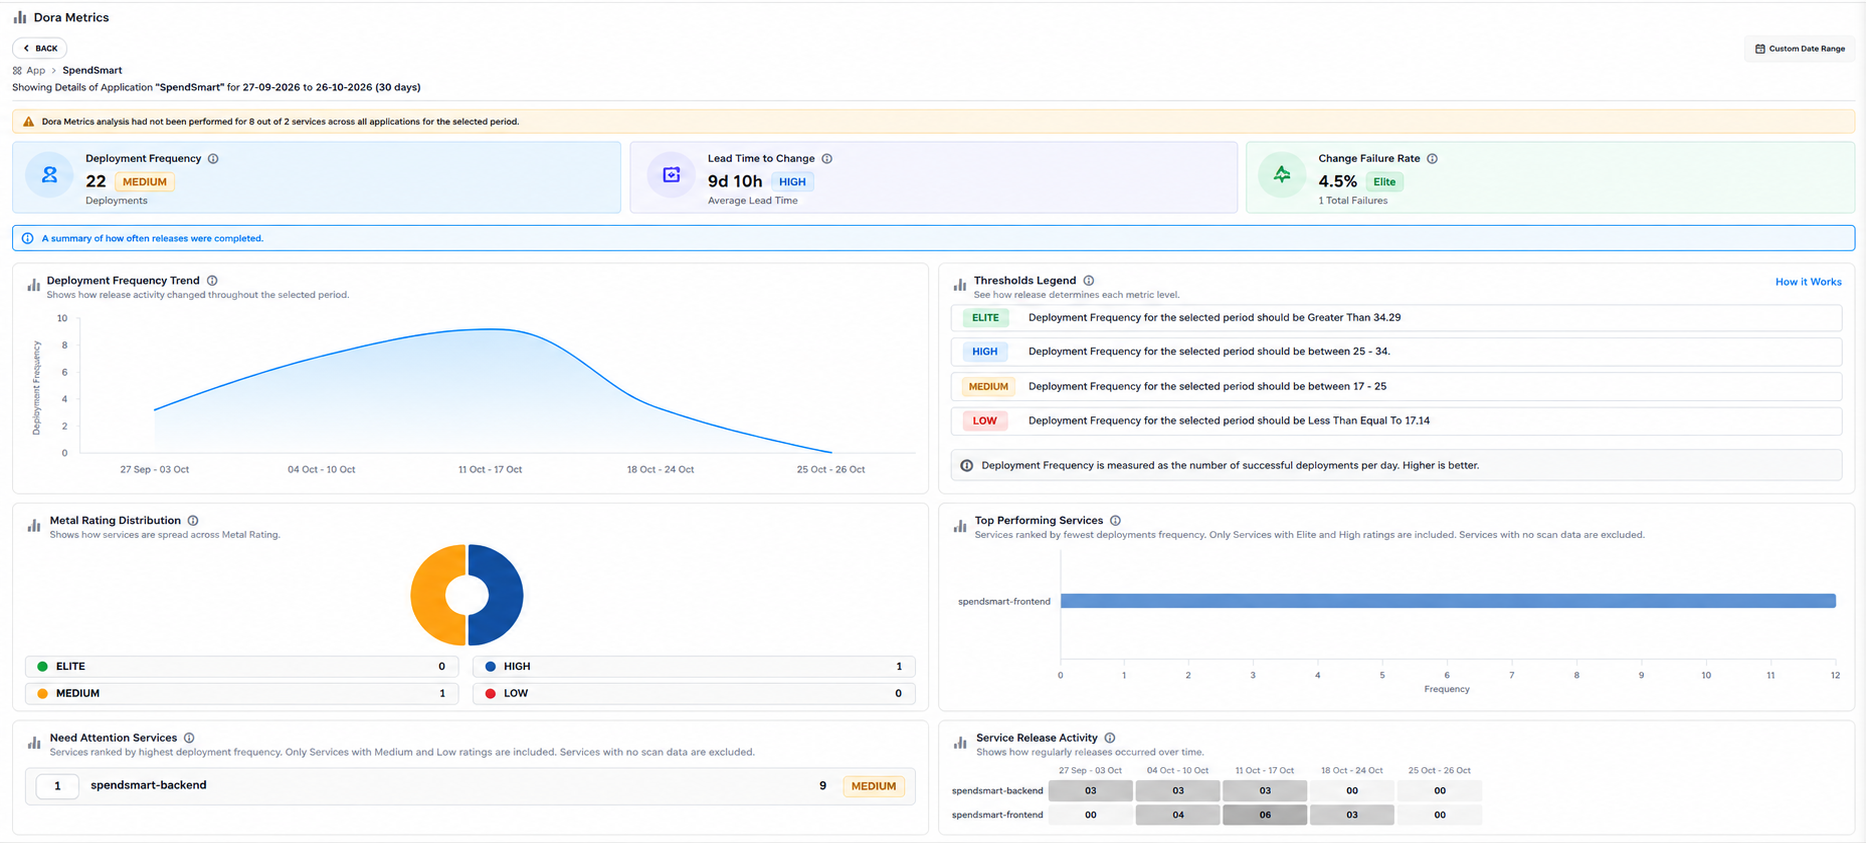
| Area | What it shows for the selected application |
|---|---|
| Header | A Back button to return to the main dashboard, the breadcrumb (for example, App › SpendSmart) and the period being shown, for example “Showing Details of Application “SpendSmart” for 27-09-2026 to 26-10-2026 (30 days)”. |
| Coverage alert | How many of the application’s services have no analysis for the selected period. |
| Metric cards | The application’s own Deployment Frequency, Lead Time to Change and Change Failure Rate, each with its value and maturity level. Select a card to switch the graphs. |
| Trend and Thresholds Legend | The trend for the selected metric, and the thresholds for this application. For Deployment Frequency, the thresholds are scaled to the application’s own number of services, so they are much lower than the organization’s. |
| Metal Rating Distribution | How the application’s services are spread across the maturity levels. |
| Top Performing Services | The application’s best services, rated Elite or High. |
| Need Attention Services | The application’s services that need improvement, rated Medium or Low. |
| Service Release Activity | How regularly each of the application’s services released over time. |
| Service Metric Table | Every metric for each of the application’s services, with a Scan History for each service. See “Service-level metrics” below. |
Service-level metrics #
In an application’s details view (see “Viewing a single application”), you can explore every metric in the selected metric group for each of the application’s services, and review each service’s scan history.
The Service Metric Table example in this section is from the Code Quality metric group, whose metrics are Git Leaks, Sonar Qube Blockers, Trivy Image Scanning and Sbom Critical. For Dora Metrics, the same table shows Deployment Frequency, Lead Time to Change and Change Failure Rate.
Service Metric Table #

What it shows: A service-level view of every metric in the selected metric group. Values, maturity levels, related counts and latest activity are calculated using the selected filters and date range.
| Column | Meaning |
|---|---|
| Service | Service name. |
| Metric columns | One column for each metric in the metric group, with the service’s value and maturity level. Click the arrows next to a heading to sort. |
| Last Activity | Date and time of the most recent activity for the service. |
| Action | Click Scan History to see the service’s individual scan records. |
Use the Service drop-down and Search… box above the table to find what you need.
Example: spendsmart-backend is rated Low for Git Leaks (59) and Sonar Qube Blockers (2056), but Elite for Trivy Image Scanning (29) and Sbom Critical (1). spendsmart-frontend has no Git Leaks (0, Elite), but is also Low for Sonar Qube Blockers (1990).
Use it to: See exactly where each service stands on every metric, and which service pulls the application’s levels down.
Scan History #
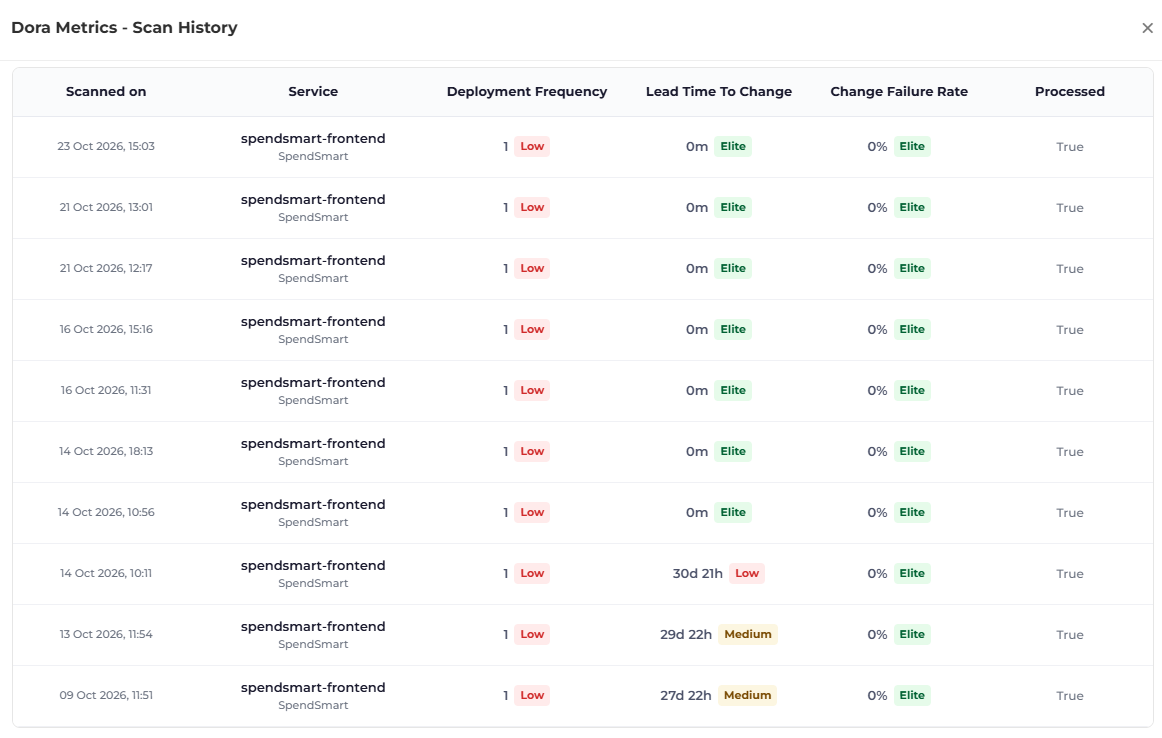
Click Scan History next to a service to open its scan records. The panel title shows the metric group, for example Dora Metrics – Scan History.
What it shows: One row for each scan of the service, newest first, with the value and maturity level of every metric in the metric group.
| Column | Meaning |
|---|---|
| Scanned on | Date and time of the scan. |
| Service | The service name, with its application below it. |
| Deployment Frequency, Lead Time To Change, Change Failure Rate | The value and maturity level recorded for each metric in that scan. |
| Processed | Whether the scan result has been processed and counts towards the dashboard. |
Example: All 10 scans of spendsmart-frontend are processed, with 1 deployment (Low) and 0% Change Failure Rate (Elite). Lead Time to Change improved from 27d 22h (Medium) on 9 October to 0m (Elite) from 14 October onward.
Use it to: Review how a service has performed over time and check the scan results behind its current values.
Good to know: The values in the Service Metric Table are calculated across all scans in the selected period, using each metric’s calculation strategy (see “Metric calculation and aggregation strategies” in the Maturity Insights Overview). They can therefore differ from the value of any single scan in Scan History.
Configuring Dora Metrics #
Connect BuildPiper to Maturity Insights #
Dora metrics are calculated from your BuildPiper build and deployment data. For this data to reach Maturity Insights, BuildPiper must be set up to push it. This is a one-time setup, done by an administrator in BuildPiper’s System Settings. It applies only to Dora Metrics: custom tools such as SonarQube, PMD or OWASP send their data through a scanning step in the build job (see “Add the scanning step to your build job” in the Custom Tools guide). If the Dora Metrics dashboard already shows data for your organization, this setup is done.
| Step | Action | Details |
|---|---|---|
| 1 | Open System Settings | Click your profile icon at the bottom of the left sidebar, then click System Settings. |
| 2 | Select BP Maturity Insights | Under System Properties, click BP Maturity Insights. To find it quickly, type “maturity” in the search box. The Maturity Insight settings open on the right. |
| 3 | Fill in the settings | Enter a value for each field, as described in the table below. |
| 4 | Apply the changes | Click Apply Immediately or Apply Async. |
| 5 | Log in again | When “Changes applied successfully” appears, log out and log in again to see the changes. |
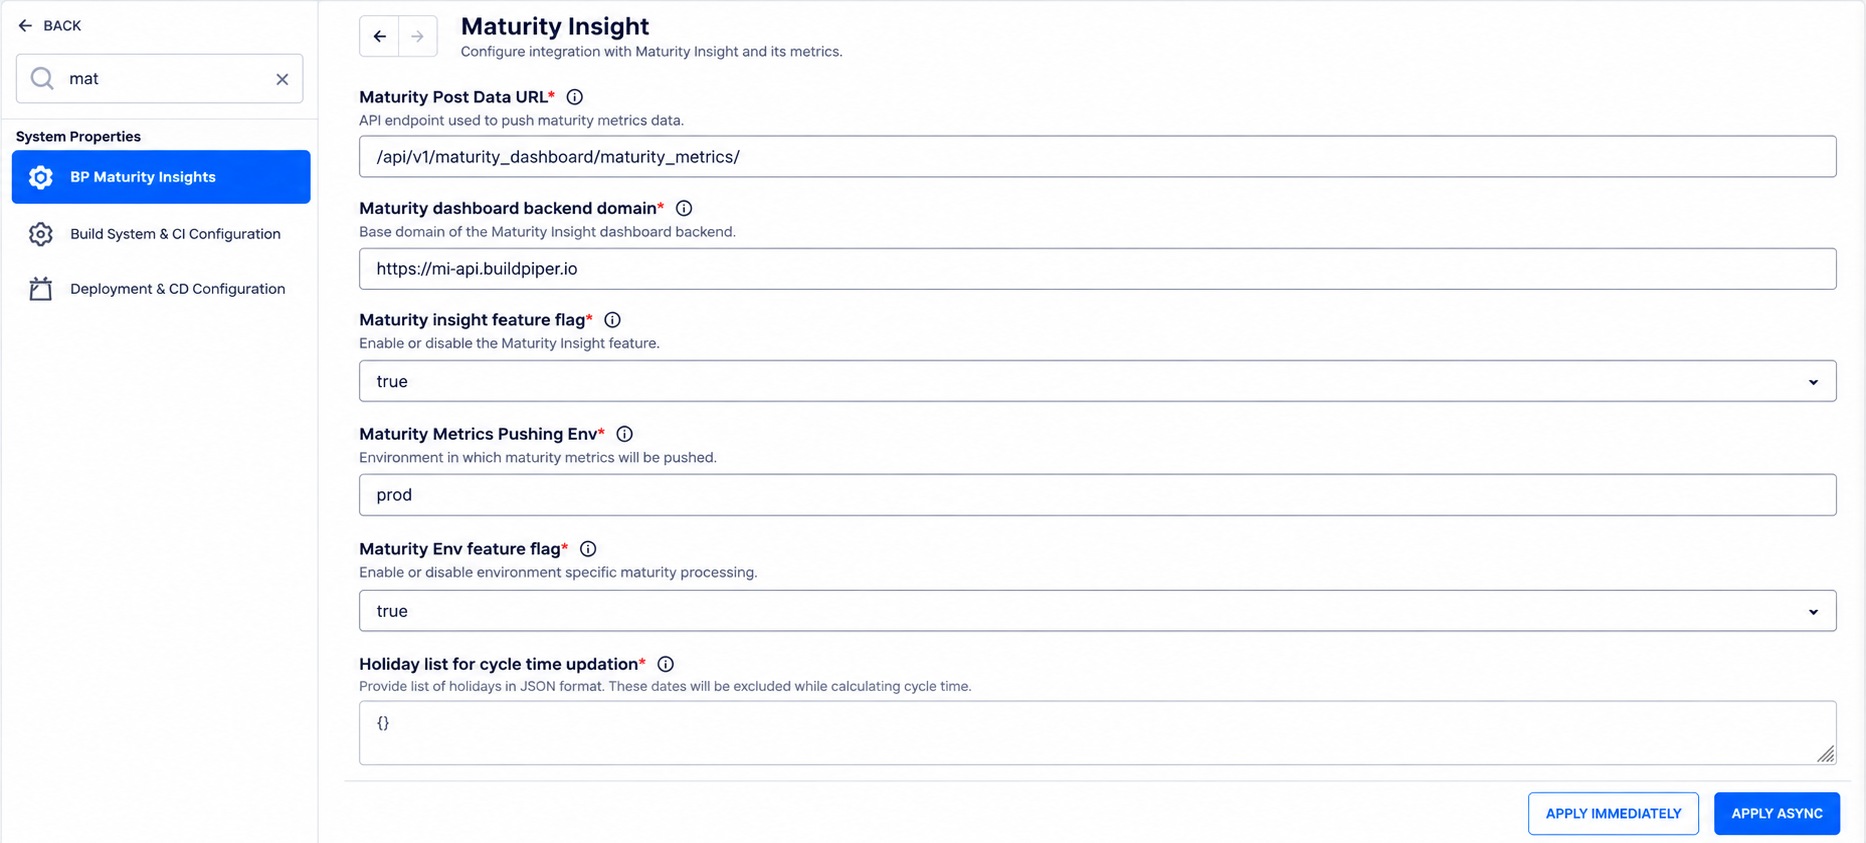
All fields are required. Each field has a short description below its name.
| Field | What to enter |
|---|---|
| Maturity Post Data URL | The API endpoint used to push maturity metrics data, for example /api/v1/maturity_dashboard/maturity_metrics/. |
| Maturity dashboard backend domain | The base domain of the Maturity Insights dashboard backend, for example https://mi-api.buildpiper.io. |
| Maturity insight feature flag | Enables or disables the Maturity Insights feature. Set it to true. |
| Maturity Metrics Pushing Env | The environment in which maturity metrics are pushed, for example prod. |
| Maturity Env feature flag | Enables or disables environment-specific maturity processing. Set it to true. |
| Holiday list for cycle time updation | A list of holidays in JSON format. These dates are excluded when cycle time is calculated. Enter {} if there are none. |
Note: Once the Maturity insight feature flag is set to true, the BuildPiper team completes the setup on the Maturity Insights side, so that data flows from BuildPiper to the maturity dashboard. Contact the BuildPiper team if data does not appear after the setup.
Enable data push for each service #
After BuildPiper is connected to Maturity Insights, turn on data push for every service you want to see in Dora Metrics. This is set in each service’s environment, in the Environment Basic Details form.
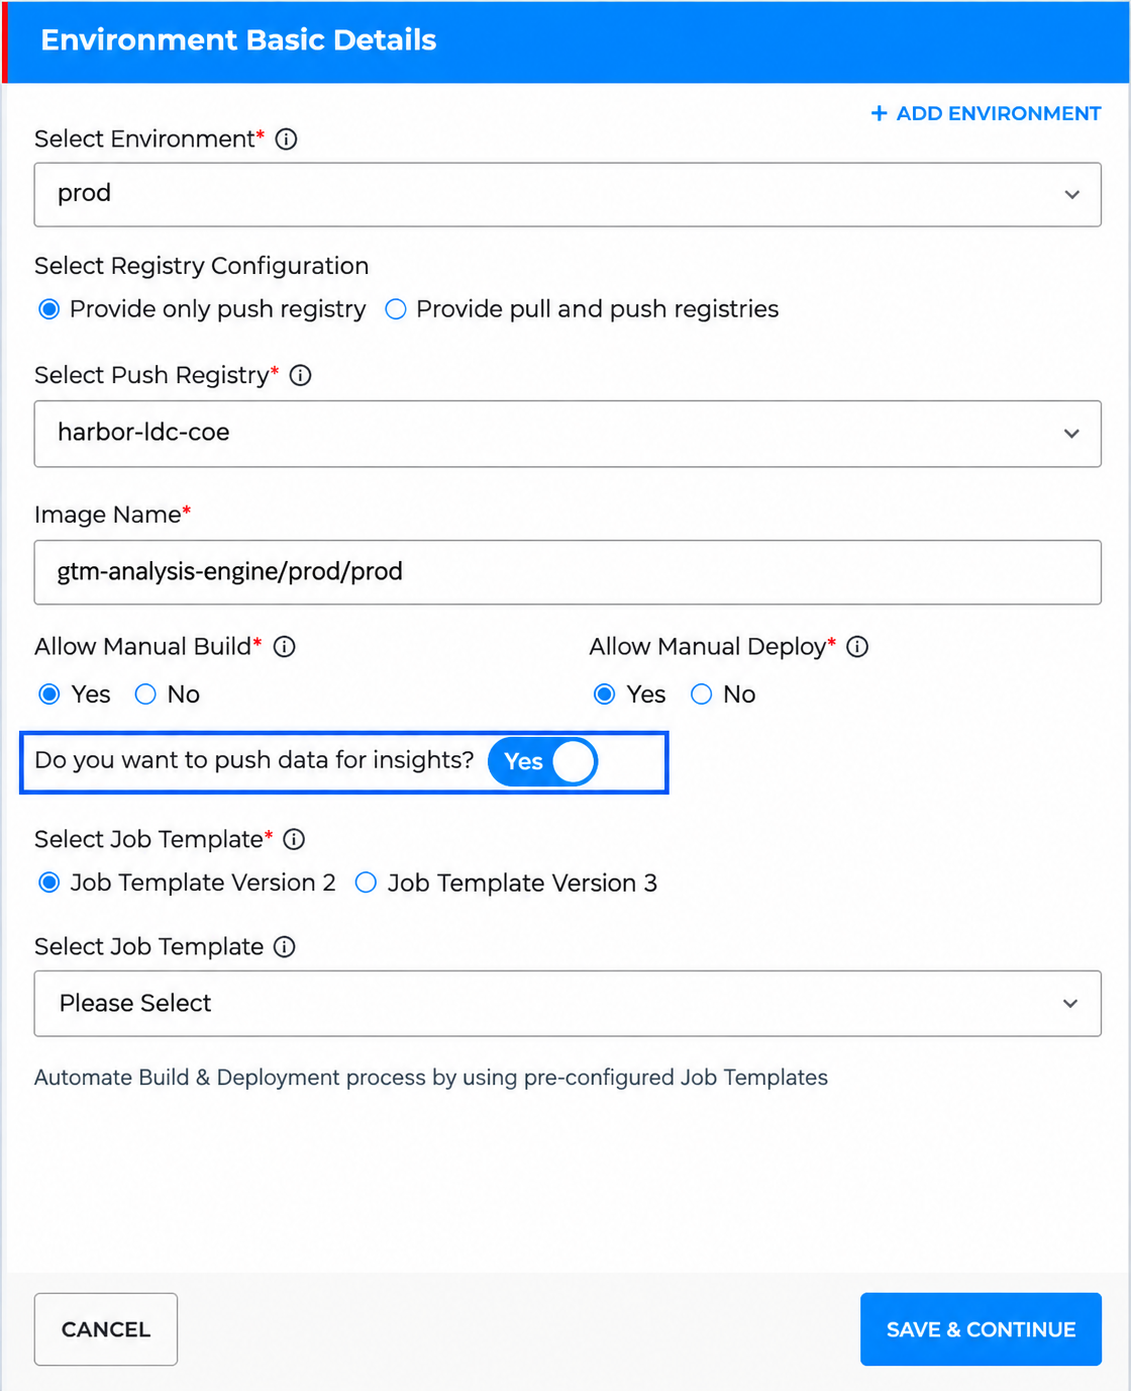
| Step | Action | Details |
|---|---|---|
| 1 | Open the service’s environment | Add a new environment to the service, or edit an existing one. The Environment Basic Details form opens. |
| 2 | Turn on data push | Set Do you want to push data for insights? to Yes. |
| 3 | Save the environment | Click Save & Continue. |
Repeat this for each service and environment whose build and deployment data you want to include. Services with this toggle set to No don’t push data, so they are not counted in Dora Metrics and appear as services with no analysis in the coverage alert.
Dora Metrics settings in Maturity Settings #
In Maturity Settings, Dora Metrics is a maturity category. Deployment Frequency, Lead Time to Change and Change Failure Rate are its maturity indexes, and each index has its own scoring for the Elite, High, Medium and Low levels.
To view or change these settings, for example to adjust the thresholds for a level or choose which graphs are shown, see “Configuring a custom tool” in the Custom Tools guide. It explains each step, from opening Maturity Settings to adding maturity indexes and defining their scoring.