

Custom Tools #
Part of the Maturity Insights documentation. For how to open the dashboard, choose a date range and how levels are decided, see the Maturity Insights Overview. For how to read the metric cards, graphs and tables on a dashboard, see the Dora Metrics Guide.
Introduction #
Your teams already use many tools to check the quality and security of their code: static analysis, secret detection, dependency and image scanning, unit testing and more. Each tool produces its own results, in its own format and its own place, which makes it hard to see the overall picture.
With custom tools, you can integrate these tools into BuildPiper Maturity Insights and view their results as analytics. Each integrated tool, or set of related tools, becomes a metric group with its own dashboard. Its results are turned into metric indexes, compared with your organization’s thresholds and rated Elite, High, Medium or Low, just like the Dora metrics.
This gives you one place to see how every application and service performs across all the tools you use, track how results change over time, and find where to improve first.
Custom tool dashboards #
You can integrate any tool whose results you want to track. Each integrated tool appears as its own dashboard in the Maturity Insights panel in the left sidebar. Click it to open the dashboard.
For example, you can integrate code quality tools such as SonarQube or PMD, security scanners such as Trivy, Git Leaks or OWASP dependency checks, SBOM analysis, and test tools such as Pytest. You can also combine the results of several tools in one dashboard, as the Code Quality dashboard does.
Example: a custom tool dashboard #
Once a custom tool is configured, its results are shown as a dashboard like the one below. This Code Quality dashboard combines the results of several tools into four metrics: Git Leaks, Sonar Qube Blockers, Trivy Image Scanning and Sbom Critical.
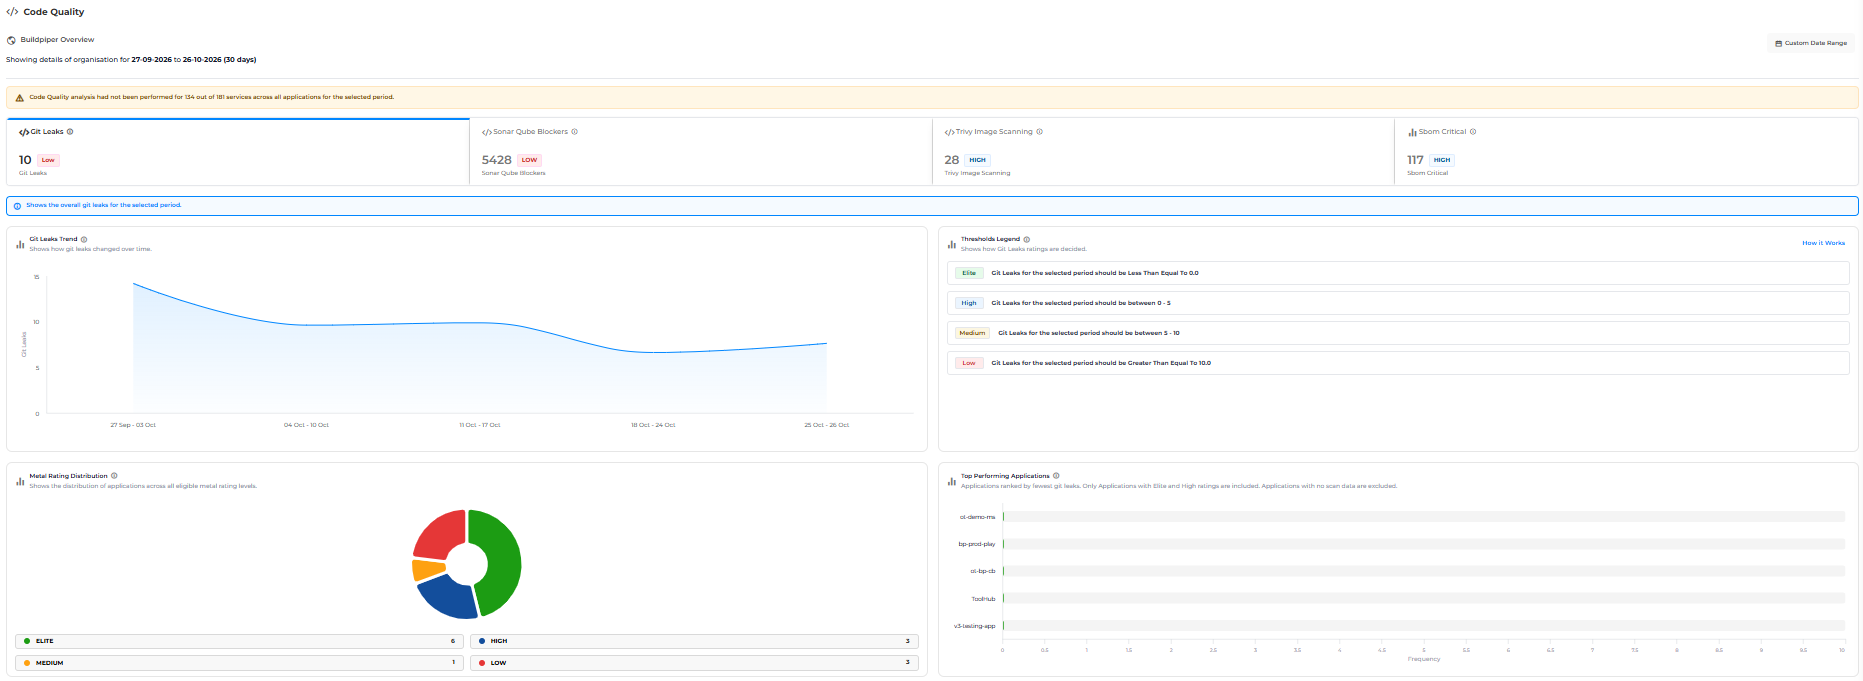
Every custom tool dashboard uses the same layout as the Dora Metrics dashboard: metric cards, metric graphs, the Application Metric Table, and service-level metrics with scan history. For how to read each of them, see the Dora Metrics Guide.
Configuring a custom tool #
This section shows how to configure a custom tool dashboard, using the Sonarqube dashboard as an example.
Custom tools are configured in Maturity Settings. Only users with the required permissions, such as a Super Admin, can open it.
Opening Maturity Settings #
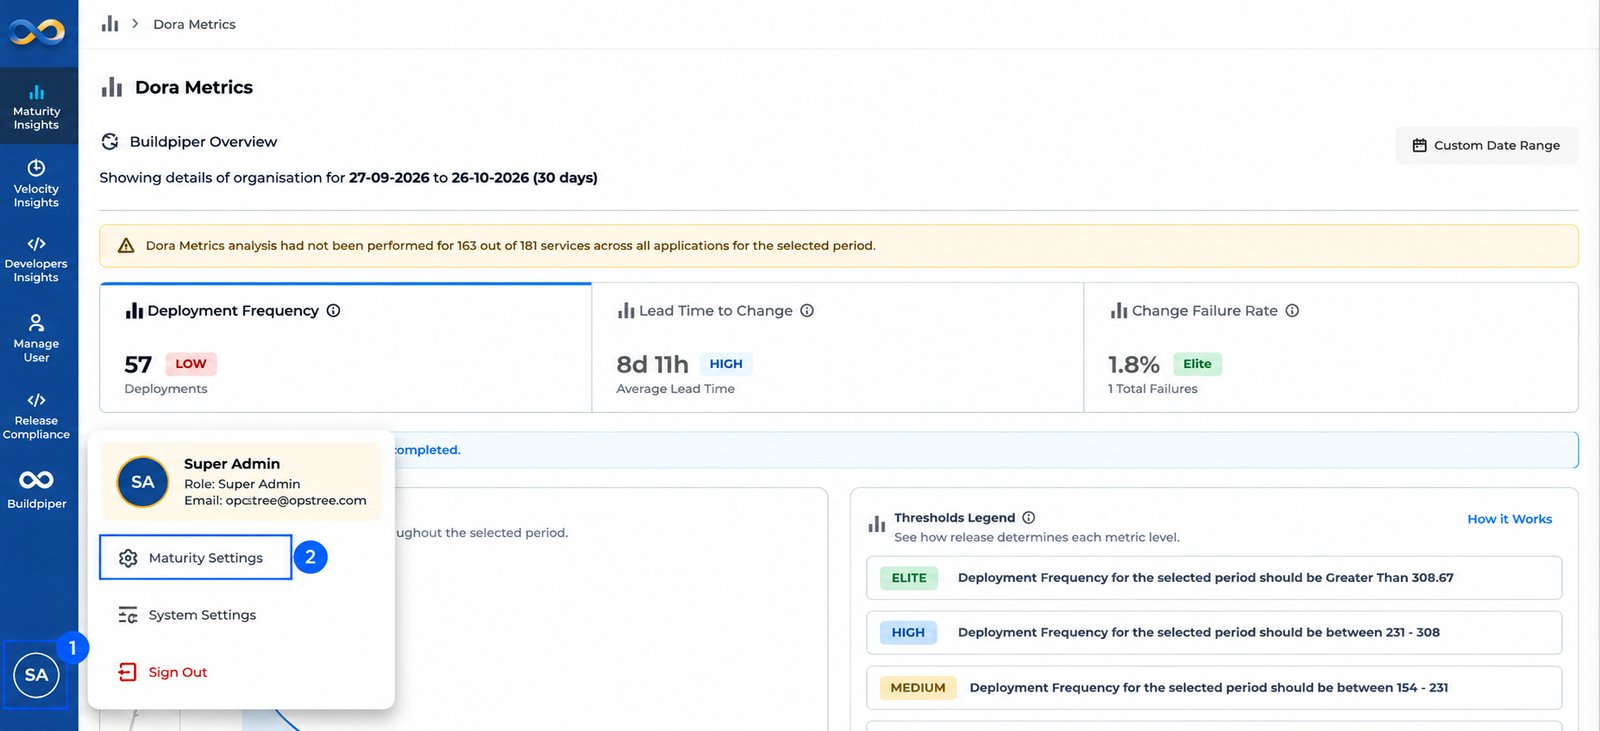
| Step | Action | Details |
|---|---|---|
| 1 | Open your profile menu | Click your profile icon (your initials, for example SA) at the bottom of the left sidebar. A menu opens with your name, role and email. |
| 2 | Select Maturity Settings | Click Maturity Settings. The Maturity Settings page opens. |
Step 1: Create a maturity category #
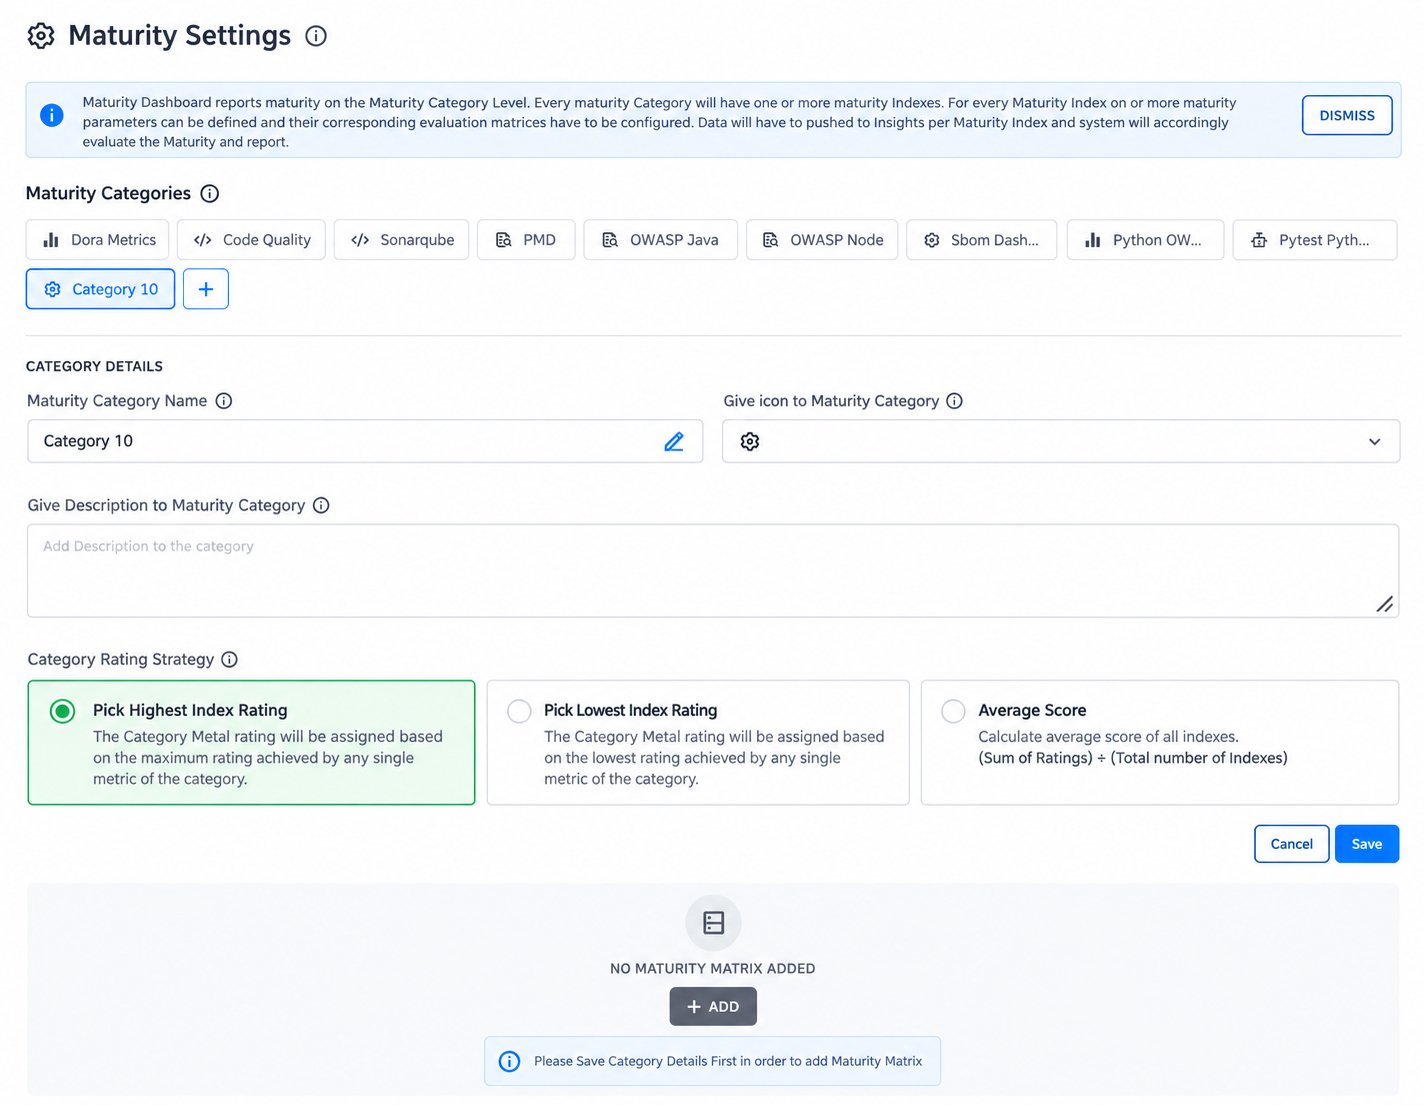
The Maturity Settings page lists all existing Maturity Categories at the top, for example Dora Metrics, Code Quality, Sonarqube and PMD. Each maturity category is shown as its own dashboard (metric group) in Maturity Insights. Click a category to view or edit its settings.
How it fits together: The dashboard reports maturity at the category level. Every maturity category has one or more maturity indexes, and every maturity index has one or more parameters with their own evaluation matrices. Data is pushed to Maturity Insights for each maturity index, and BuildPiper evaluates and reports the maturity.
To create a new category:
• Click + next to the list of maturity categories. A new category (for example, Category 10) is added and its Category Details form opens.
• Fill in the category details. Hover over the ⓘ icon next to a field to see what to enter.
| Field | What to enter |
|---|---|
| Maturity Category Name | The name of your maturity category. It is shown as the dashboard name in Maturity Insights, for example SonarQube. Click the pencil icon to edit it. |
| Give icon to Maturity Category | The icon for your maturity category, shown next to its name in Maturity Insights. Choose one from the drop-down. |
| Give Description to Maturity Category | A description of your maturity category: what it measures, for example “SonarQube is an open source platform designed to continuously inspect the quality and security of source code.” |
| Category Rating Strategy | How the category’s overall level is decided from the levels of its indexes (see below). |
When the details are complete, click Save. Click Cancel to discard your changes.
Category Rating Strategy #
| Option | How the category level is decided |
|---|---|
| Pick Highest Index Rating | The category’s level is the highest level reached by any of its indexes. |
| Pick Lowest Index Rating | The category’s level is the lowest level reached by any of its indexes, so one weak area isn’t hidden. |
| Average Score | The average of the levels of all indexes: (Sum of ratings) ÷ (Total number of indexes). |
Note: You must save the category details before you can add a maturity matrix. Until then, the section below the form shows “No maturity matrix added” and the message “Please Save Category Details First in order to add Maturity Matrix”.
Example: the SonarQube category #
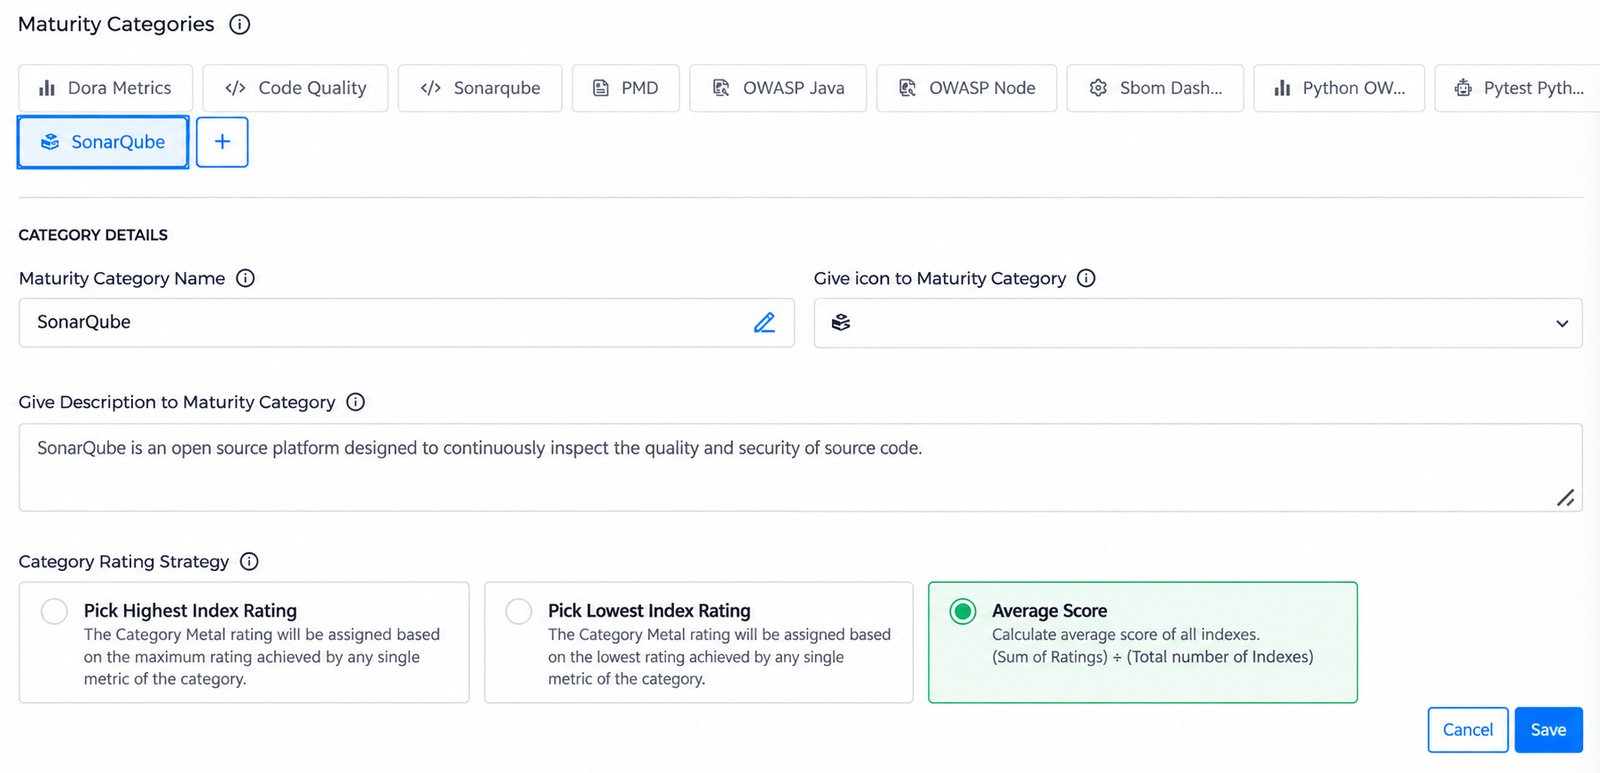
Here the category is named SonarQube, with the SonarQube icon and a short description of the tool. The Average Score rating strategy is selected, so the category’s level is the average of the levels of all its indexes. After you click Save, the new SonarQube category appears in the list of maturity categories.
Step 2: Add a maturity matrix #
After you save the category details, the Maturity Matrix list below the form becomes available. A maturity matrix defines a sub-metric that the category measures, that is, one maturity index, such as Sonar Qube Blockers. Add one maturity matrix for each metric you want to show on the dashboard.
Click + ADD in the maturity matrix section. The Add Maturity Index form opens.
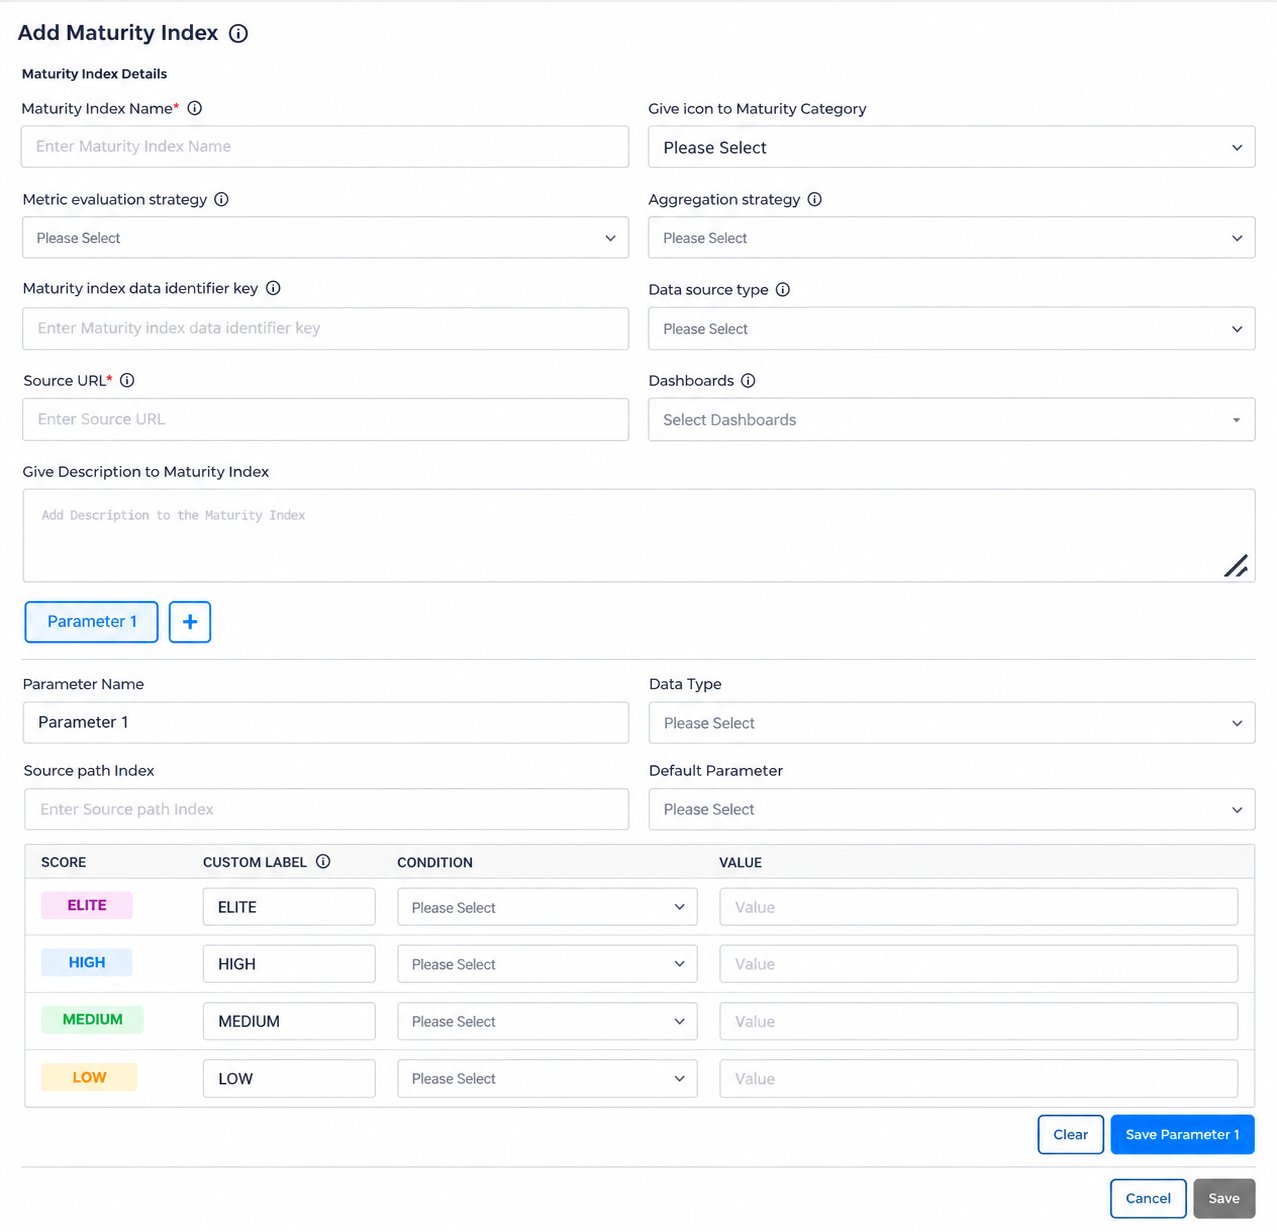
The form has two parts: the maturity index details, which describe the metric and where its data comes from, and one or more parameters, which define the values that are read and how each value is rated.
Maturity index details #
| Field | What to enter |
|---|---|
| Maturity Index Name (required) | The sub-metric that your maturity category measures, for example Sonar Qube Blockers. It is shown on the metric card and in the tables. |
| Give icon to Maturity Category | The icon shown on the metric card. |
| Metric evaluation strategy | The rating method used for the maturity index, that is, how the level is decided when several values are combined: Highest, Lowest or Average. See “How the level is decided” in the Maturity Insights Overview. |
| Aggregation strategy | How individual measurements are combined into an overall metric, so you can see trends and make meaningful comparisons across teams or time periods: Latest Per Service, Per Scan or Per Period. See “Metric calculation and aggregation strategies” in the Maturity Insights Overview. |
| Maturity index data identifier key | The unique identification key for the maturity index. Data pushed to Maturity Insights uses this key to identify which maturity index it belongs to. |
| Data source type | The format of the data the metric is captured from, for example CSV. |
| Source URL (required) | The endpoint from which the metric is captured. |
| Dashboards | The graphs to show for the maturity index on its dashboard, for example Trend Graph, Threshold Summary, Level-wise Distribution, Contributor Analysis, Top Rankings Graph and Worst Rankings Graph. You can select up to 6. |
| Give Description to Maturity Index | A short description of what the metric measures. It is shown when users hover over the ⓘ icon on the metric card. |
Parameters #
Each maturity index has one or more parameters. Parameter 1 is added by default, and its tab takes the parameter’s name once you enter one. Click + next to it to add another parameter, and click a parameter’s tab to edit it.
| Field | What to enter |
|---|---|
| Parameter Name | The name of the parameter, for example Blockers. |
| Data Type | The type of value the parameter holds, for example INT (whole number). |
| Source path Index | The position of the parameter’s value in the data received from the source, for example 0 for the first value. |
| Default Parameter | Set to TRUE for the parameter whose value is shown for the maturity index on the dashboard. |
Scoring table #
For each parameter, define the condition that assigns each maturity level:
| Column | What to enter |
|---|---|
| Score | The maturity level: Elite, High, Medium or Low. This can’t be changed. |
| Custom Label | A custom name for the score. By default it is the level name, for example ELITE. The custom label is used across all metric groups. |
| Condition | How the parameter’s value is compared: LESS_THAN_EQUAL_TO, BETWEEN or GREATER_THAN_EQUAL_TO. |
| Value | The value to compare with. For BETWEEN, enter the lower and upper values. |
Example: the blocker violations index for SonarQube #
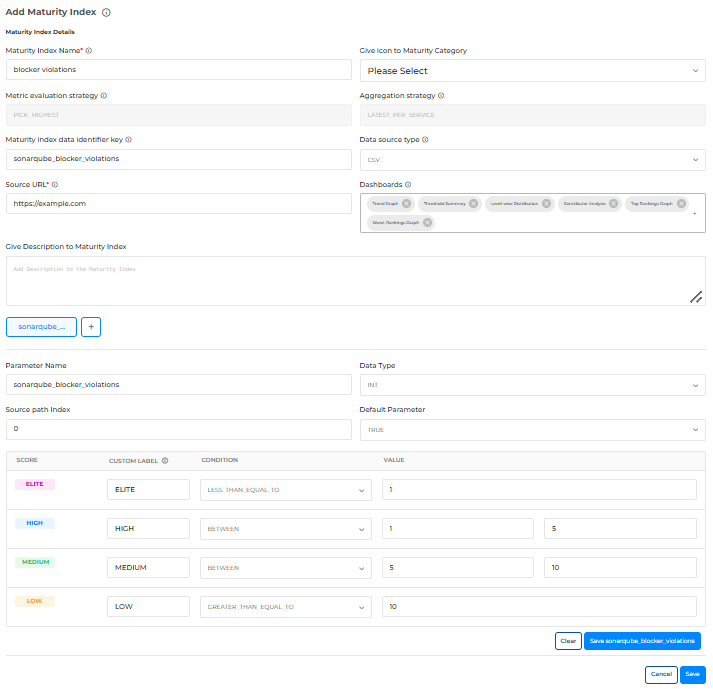
| Field | Value in this example |
|---|---|
| Maturity Index Name | blocker violations |
| Metric evaluation strategy | PICK_HIGHEST |
| Aggregation strategy | LATEST_PER_SERVICE |
| Maturity index data identifier key | sonarqube_blocker_violations |
| Data source type | CSV |
| Source URL | The endpoint the data is captured from, for example https://example.com |
| Dashboards | Trend Graph, Threshold Summary, Level-wise Distribution, Contributor Analysis, Top Rankings Graph and Worst Rankings Graph |
| Parameter Name | sonarqube_blocker_violations |
| Data Type | INT |
| Source path Index | 0 |
| Default Parameter | TRUE |
The scoring for this parameter is:
| Score | Condition | Value |
|---|---|---|
| Elite | LESS_THAN_EQUAL_TO | 1 |
| High | BETWEEN | 1 and 5 |
| Medium | BETWEEN | 5 and 10 |
| Low | GREATER_THAN_EQUAL_TO | 10 |
So a service with 1 blocker violation or fewer is rated Elite, and one with 10 or more is rated Low.
Saving the maturity index #
• Click Save followed by the parameter name, for example Save sonarqube_blocker_violations, to save the parameter and its scoring. Click Clear to reset the parameter’s fields.
• Repeat for each parameter you added.
• Click Save to save the maturity index. Click Cancel to close the form without saving.
Add a maturity index in the same way for each metric you want to show on the dashboard.
Step 3: Review the maturity matrix list #
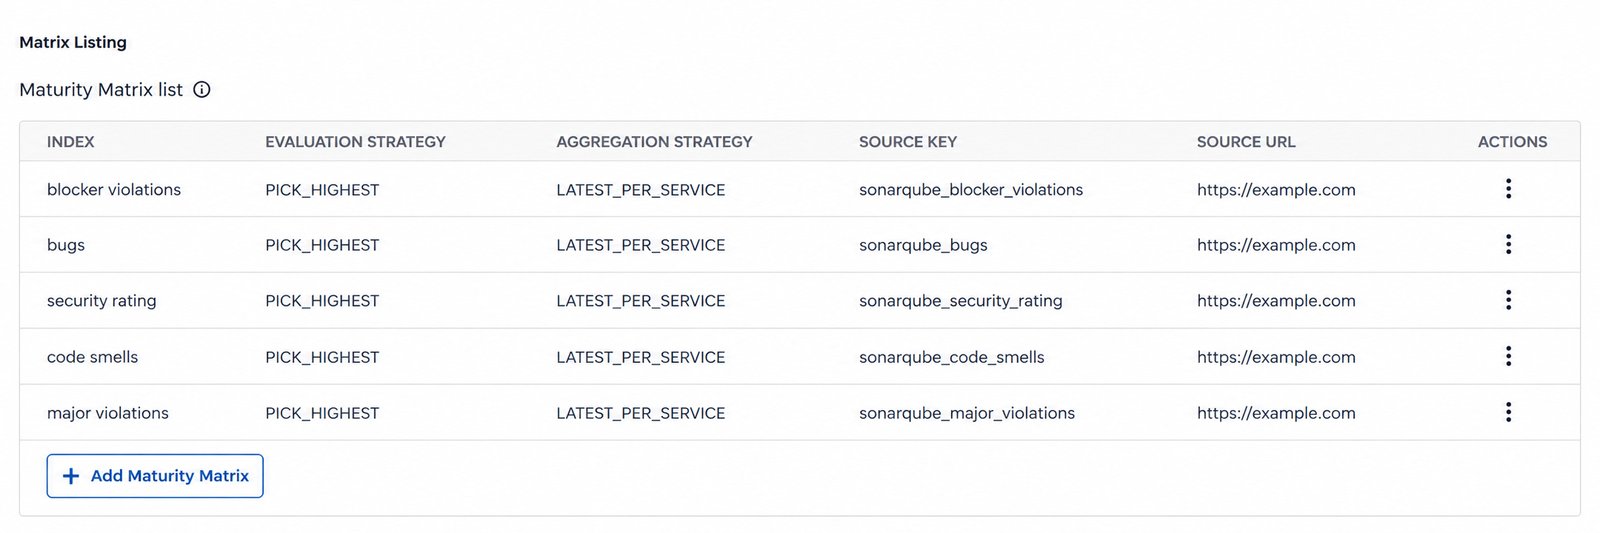
Each saved maturity index is added to the Maturity Matrix list under Matrix Listing.
| Column | Meaning |
|---|---|
| Index | The maturity index name. |
| Evaluation Strategy | The metric evaluation strategy, for example PICK_HIGHEST. |
| Aggregation Strategy | The aggregation strategy, for example LATEST_PER_SERVICE. |
| Source Key | The maturity index data identifier key, for example sonarqube_blocker_violations. |
| Source URL | The endpoint the metric is captured from. |
| Actions | Click ⋮ to manage the maturity index. |
Click + Add Maturity Matrix to add another maturity index.
Example: The SonarQube category has five maturity indexes: blocker violations, bugs, security rating, code smells and major violations. Each one uses PICK_HIGHEST and LATEST_PER_SERVICE, and has its own source key, such as sonarqube_bugs or sonarqube_code_smells. Each maturity index is shown as a metric card on the SonarQube dashboard.
Step 4: Add the scanning step to your build job #
The custom tool’s results are sent to Maturity Insights by a step that runs in your build. For SonarQube, this is the SONAR_SCANNING step. Add it to the Build Job of the job template your services use, so that every build runs the scan and pushes its results.
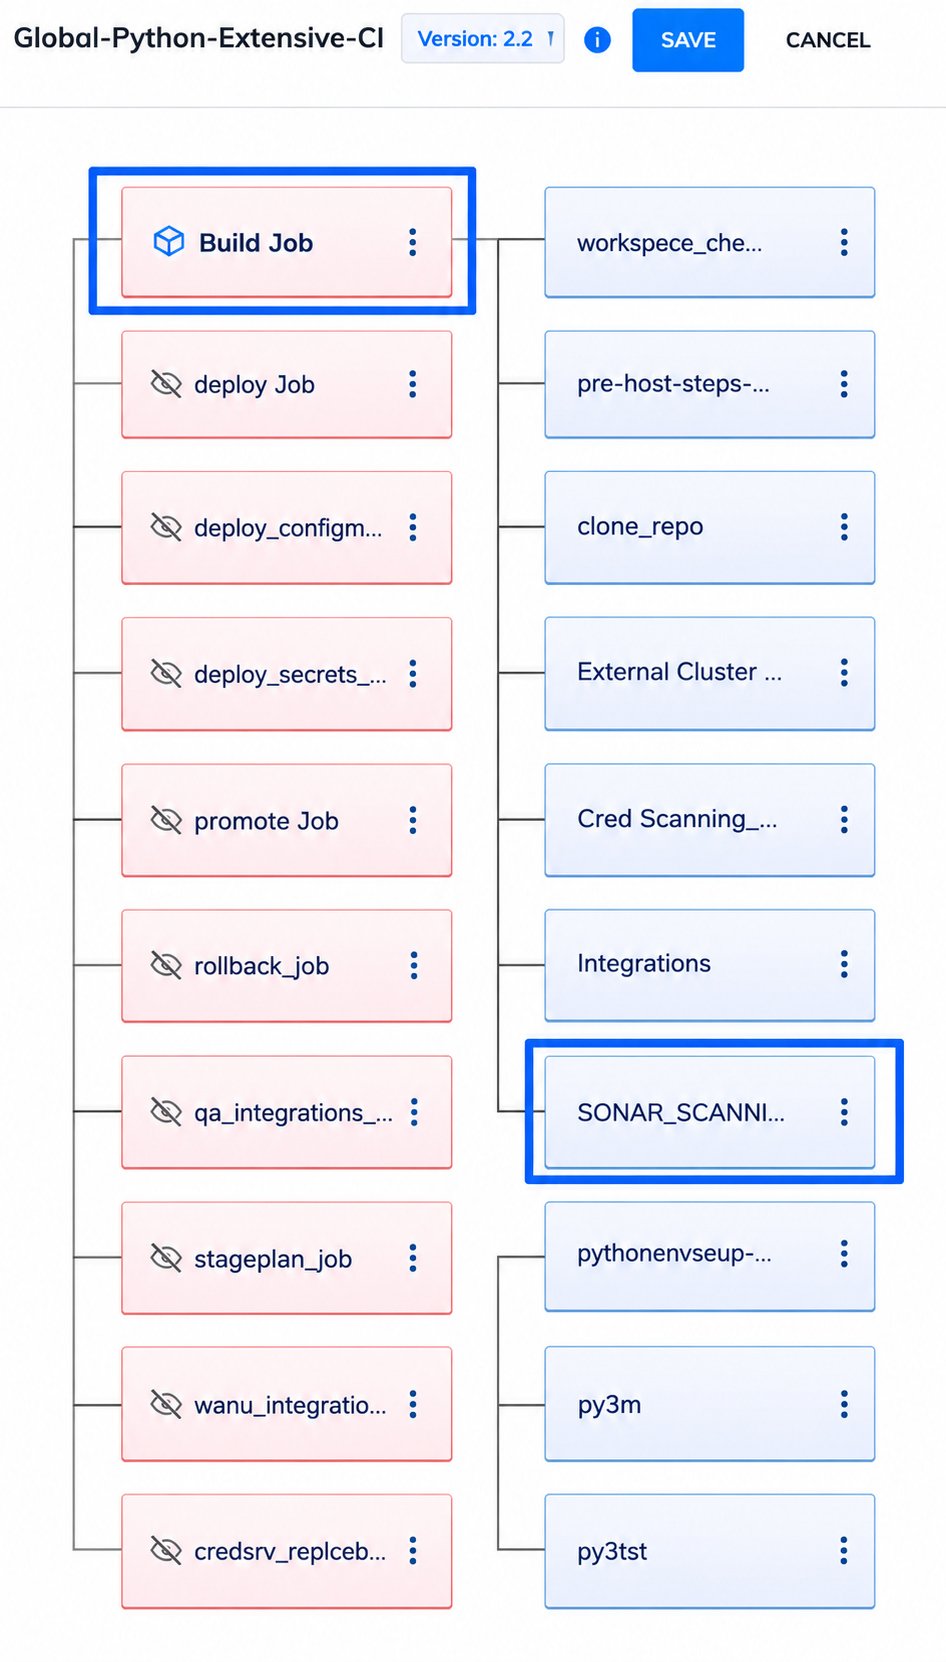
| Step | Action | Details |
|---|---|---|
| 1 | Open the job template | Open the job template used by your services, for example Global-Python-Extensive-CI. |
| 2 | Select the Build Job | Click Build Job. Its steps are listed on the right. |
| 3 | Add the scanning step | Add the SONAR_SCANNING step to the Build Job. |
| 4 | Configure the step | Enter the step’s values, as described below, and click Save. |
| 5 | Save the template | Click Save at the top of the job template. |
For how to create a job template, refer to the Job Template documentation. For how to create a step, refer to the Step Catalog documentation.
Read more: Job Template
Step Catalog
Configuring the SONAR_SCANNING step #
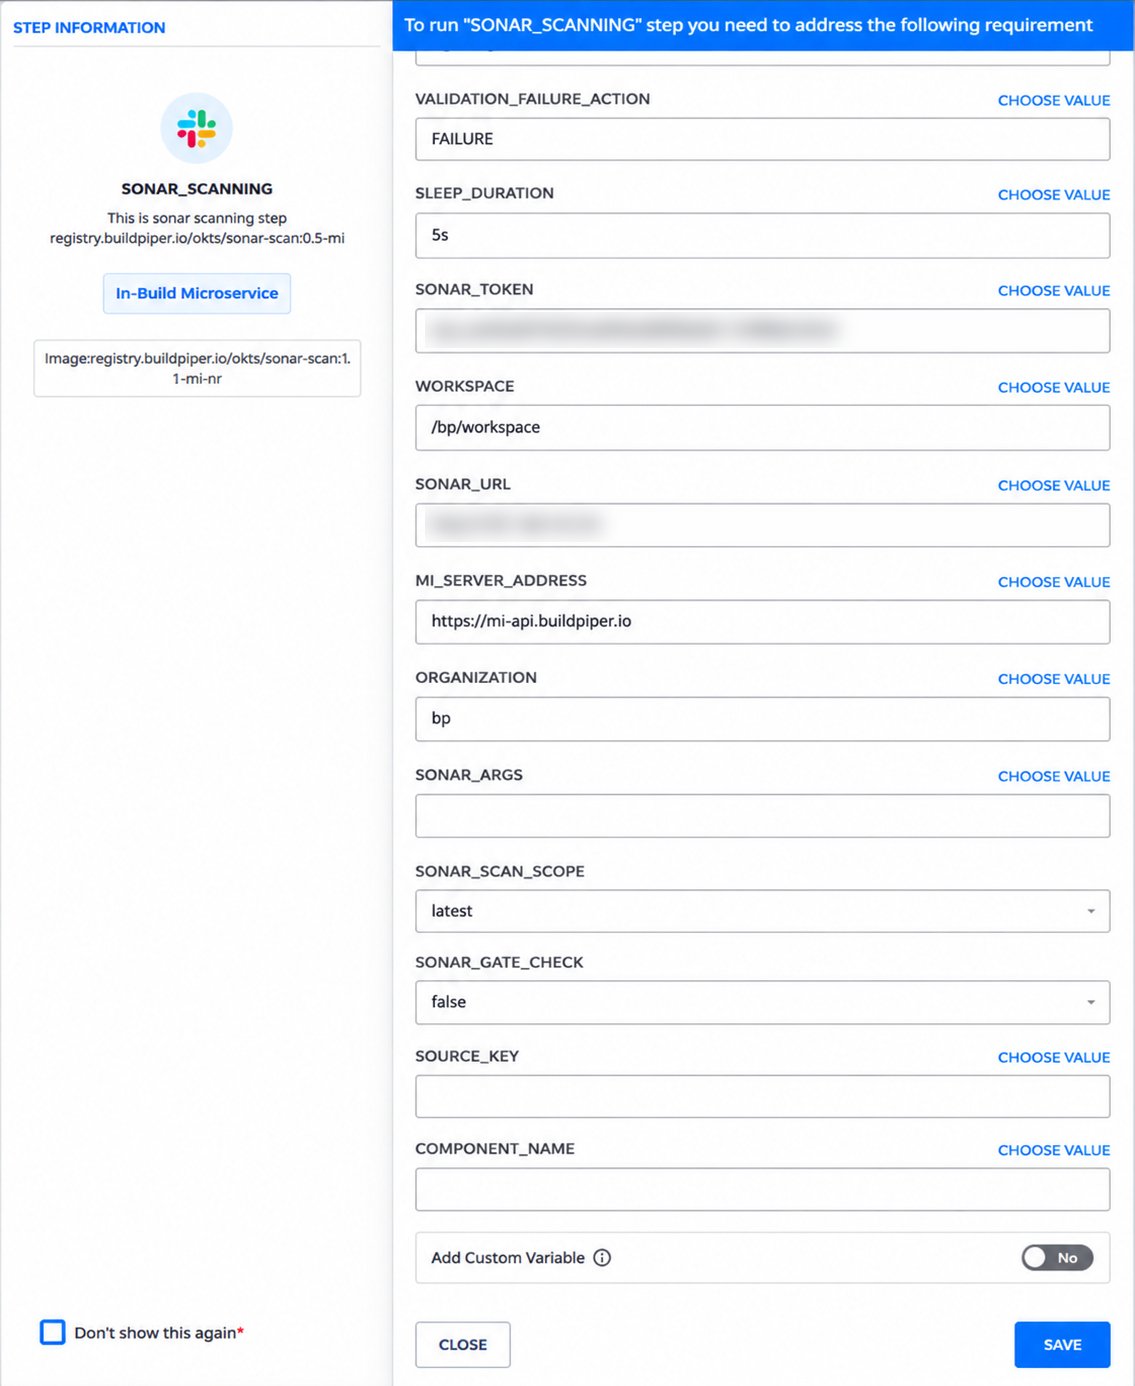
The settings that connect the step to SonarQube and Maturity Insights are:
| Setting | What to enter |
|---|---|
| SONAR_URL | The address of your SonarQube server. |
| SONAR_TOKEN | The SonarQube access token used to read the scan results. |
| MI_SERVER_ADDRESS | The address of the Maturity Insights backend that the results are pushed to, for example https://mi-api.buildpiper.io. |
| ORGANIZATION | Your organization’s name, for example bp. |
Click Choose Value next to a setting to select a saved value instead of typing it. For the other settings, see the step’s description in the Step Catalog documentation.
After the template is saved, each build runs the scan and pushes its results to Maturity Insights, where they are matched to the maturity indexes you configured.
Step 5: View the SonarQube dashboard #
Once the configuration is saved and data is received for the maturity indexes, the Sonarqube dashboard appears in the Maturity Insights panel:
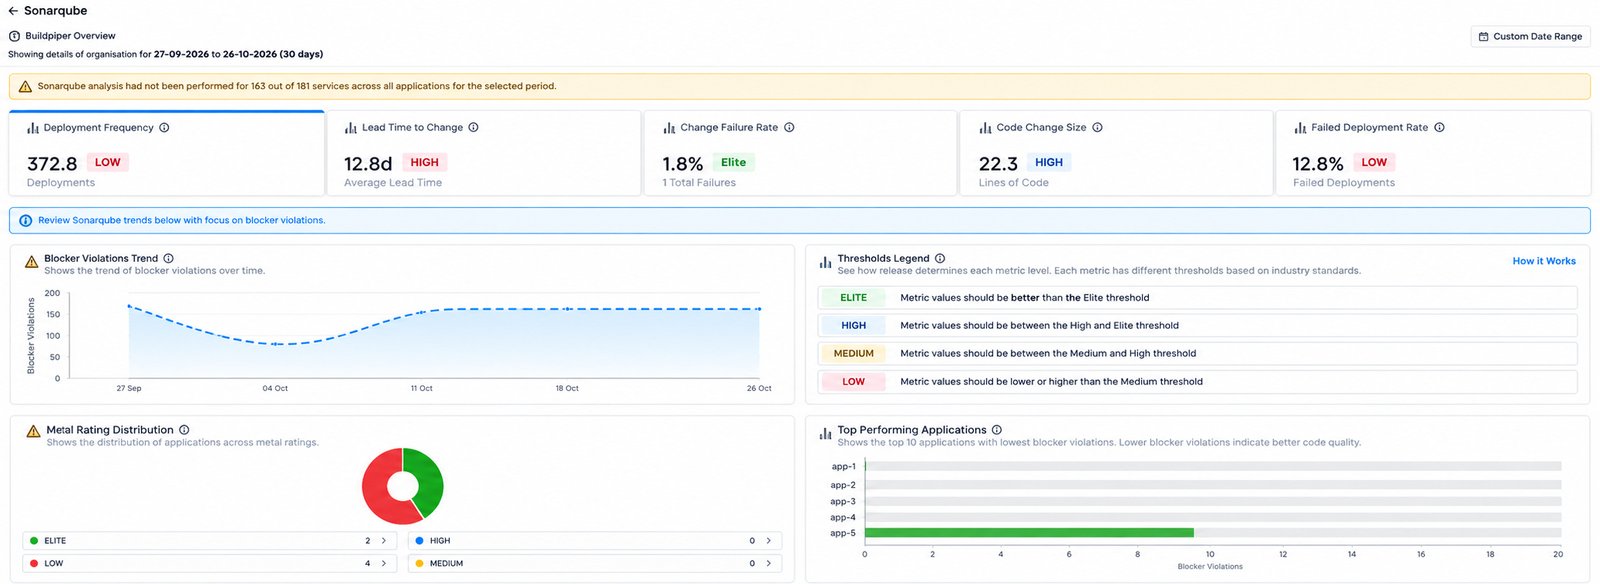
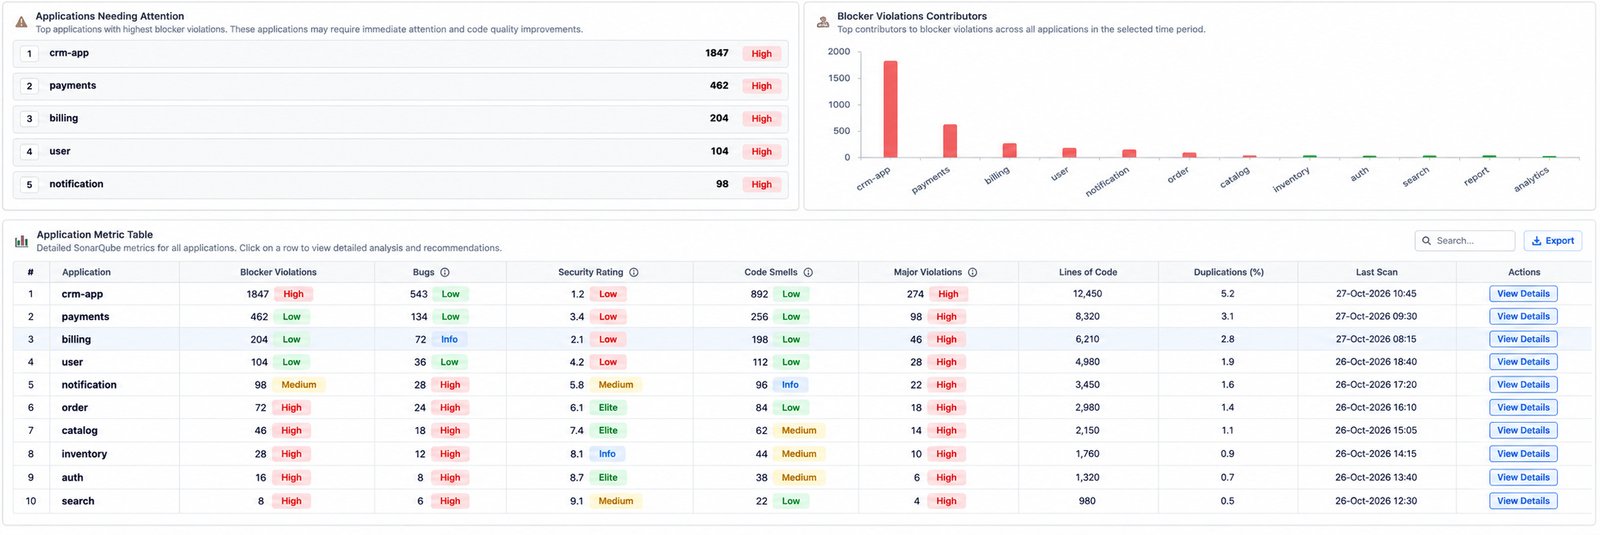
Understanding the graphs: The graphs on a custom tool dashboard work the same way as the Dora Metrics graphs. To understand each graph, refer to “Metric graphs” in the Dora Metrics Guide, and to the graph sections in the Deployment Frequency, Lead Time to Change and Change Failure Rate guides. For example, Blocker Violations Contributors reads like Change Failure Rate Contributors, and Applications Needing Attention reads like Need Attention Applications.