

Service Monitoring #
1. Service Monitoring Overview #
After a VM-based service is deployed, you need to know whether the deployment completed as expected. Service Monitoring gives you a live view of the current deployment of the service in one place, from the service page in BuildPiper, so you can check its status and find problems without leaving the platform.
Using Service Monitoring, you can:
- 1
Check the status of the current deployment.
- 2
See how many VMs succeeded and how many failed.
- 3
Review each phase of the rolling deployment, with the number of VMs on the old and new artifact.
- 4
View the steps that ran in each phase.
2. Navigation #
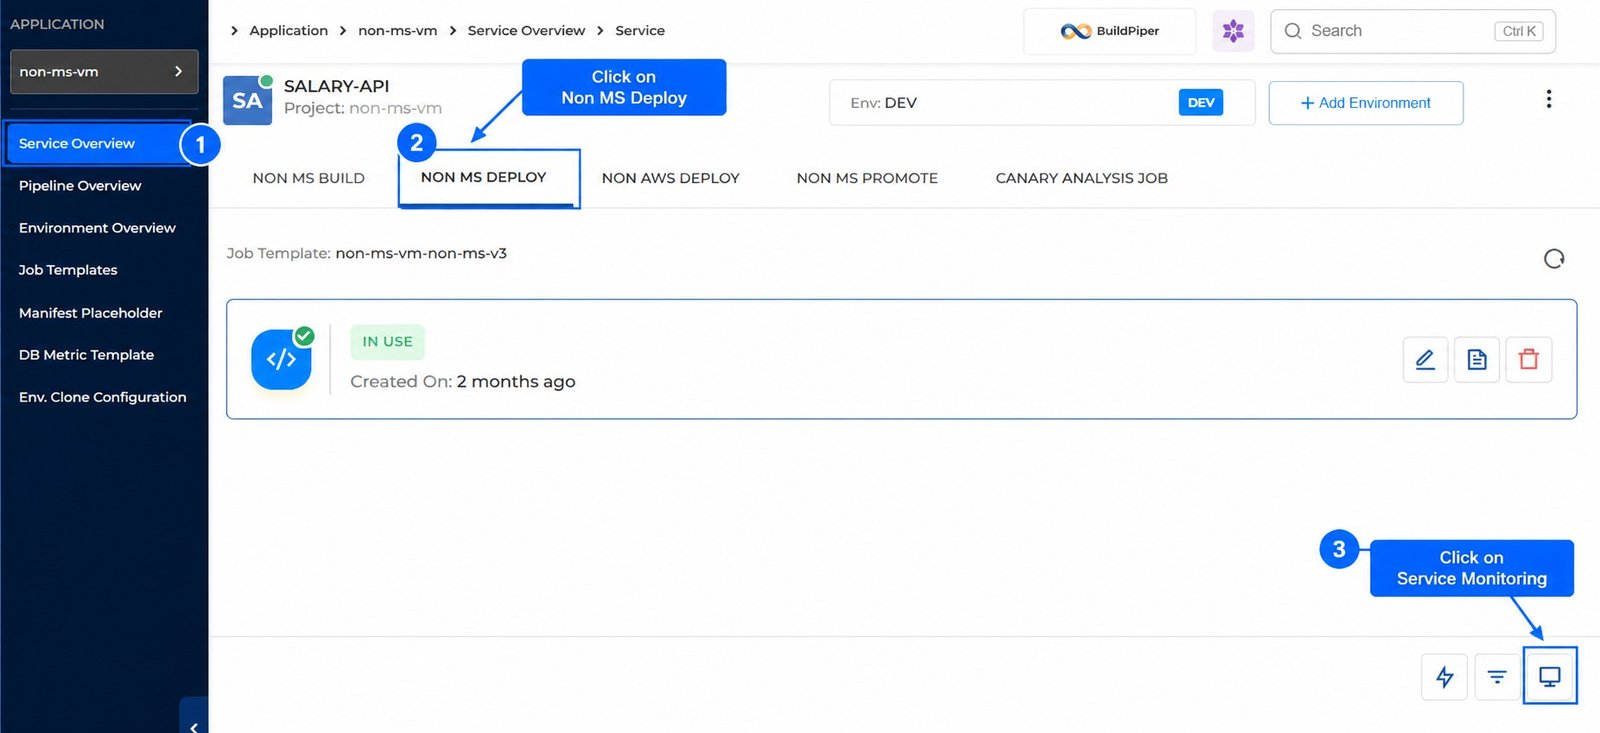
Figure 1: Navigation to Service Monitoring
- 1
Log in to BuildPiper.
- 2
Switch to User Portal.
- 3
Click Application and select the application.
- 4
Open Service Overview.
- 5
Select the service.
- 6
Select the NON MS DEPLOY tab.
- 7
Click Service Monitoring at the bottom right.
3. Current Deployment #
The screen shows the service name and environment at the top, followed by the status of the current deployment.
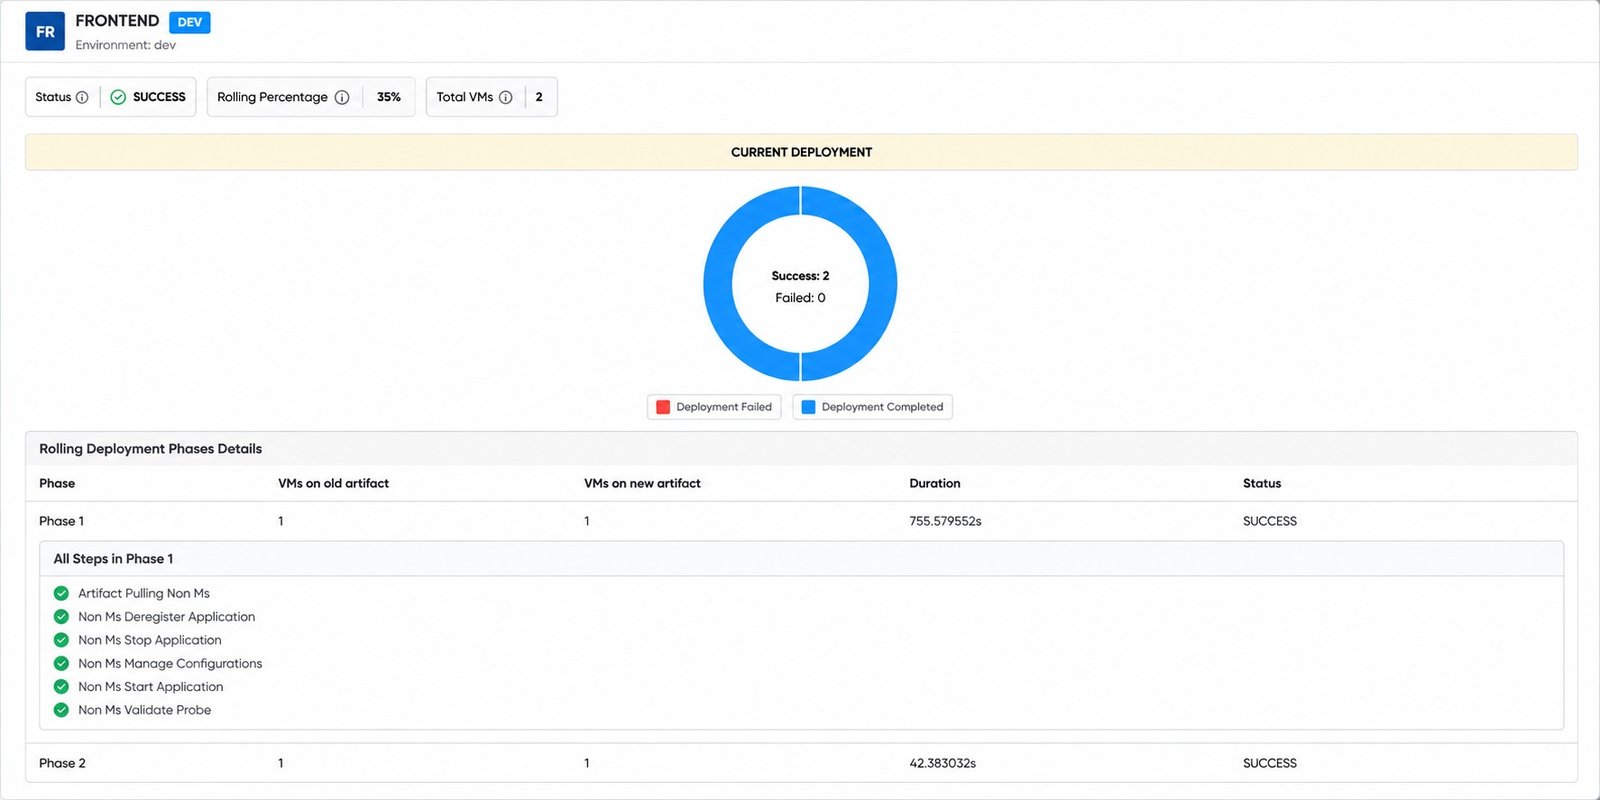
Figure 2: Service Monitoring – Current Deployment
Deployment Summary #
| Item | Description |
|---|---|
| Status | The status of the current deployment, for example SUCCESS. |
| Rolling Percentage | The rolling percentage of the deployment, for example 35%. |
| Total VMs | The total number of VMs in the deployment, for example 2. |
The Current Deployment chart shows the number of VMs that succeeded and failed. The legend shows Deployment Completed in blue and Deployment Failed in red.
Rolling Deployment Phases Details #
This table lists each phase of the rolling deployment.
| Column | Description |
|---|---|
| Phase | The phase of the rolling deployment, for example Phase 1. |
| VMs on old artifact | The number of VMs still running the old artifact in the phase. |
| VMs on new artifact | The number of VMs running the new artifact in the phase. |
| Duration | The time the phase took. |
| Status | The result of the phase, for example SUCCESS. |