

Change Failure Rate #
Part of the Dora Metrics documentation. For the metric cards, the graph types, the Application Metric Table and service-level metrics, see the Dora Metrics Guide. For how to open the dashboard and choose a date range, see the Maturity Insights Overview.
What is Change Failure Rate? #
Change Failure Rate (CFR) measures the percentage of production deployments that require corrective action after release, such as a hotfix or rollback. It reflects the stability of your delivery process: a lower Change Failure Rate indicates more reliable releases and fewer issues reaching production.
In BuildPiper, a deployment is considered a failed change if it is later followed by a hotfix or rollback. The original change was released successfully, but later needed additional work to fix or reverse it in production. A lower value is better.
To view it, select the Change Failure Rate card on the Dora Metrics dashboard. The graphs below the cards then show its trend, thresholds, maturity levels, top performing applications and the applications that contribute most to failed changes. This guide explains how the metric is calculated and how to read each graph.
How Change Failure Rate is calculated #
You can also see this explanation on the dashboard: click How it Works in the Thresholds Legend.
Change Failure Rate is measured as a percentage. It uses the Per Scan aggregation and the Highest rating rule.
What is counted #
| Deployment type | How it is counted |
|---|---|
| Valid deployments | Successful deployments and hotfix deployments. |
| Failed valid deployments | Valid deployments that are later followed by a hotfix or rollback. |
| Rollback deployments | Corrective actions only. They are not counted as valid deployments, but they mark the deployment before them as failed. |
Deployments that are not followed by a hotfix or rollback are considered successful changes.
Formula #
CFR (%) = (Failed valid deployments ÷ Total valid deployments) × 100
The result is then compared with the configured maturity thresholds to give the level.
Worked example #
A service has seven deployments in the selected period:
| Deployment | Type | How it is counted |
|---|---|---|
| D1 | Success | Valid deployment. No corrective action was needed. |
| D2 | Success | Valid deployment. Marked as failed by D3. |
| D3 | Hotfix | Valid deployment. Marks D2 as failed. |
| D4 | Success | Valid deployment. Marked as failed by D5. |
| D5 | Hotfix | Valid deployment. Marks D4 as failed. |
| D6 | Success | Valid deployment. Marked as failed by D7. |
| D7 | Rollback | Corrective action only. Not counted as a valid deployment. Marks D6 as failed. |
• Total valid deployments: 6 (4 successful and 2 hotfix deployments).
• Failed valid deployments: 3 (D2, D4 and D6 needed corrective action later).
• CFR: (3 ÷ 6) × 100 = 50%. Three out of every six valid deployments needed corrective action after release.
At service, application and organization level #
At each level, BuildPiper adds up the failed and valid deployments from everything within it, then applies the formula:
| Level | Calculation | CFR shown |
|---|---|---|
| Service | (3 failed ÷ 6 valid) × 100 | 50% |
| Application (failed and valid deployments from its services) | (4 failed ÷ 10 valid) × 100 | 40% |
| Organization (failed and valid deployments from all applications and services) | (7 failed ÷ 20 valid) × 100 | 35% |
Good to know: Application and organization CFR are calculated from the combined deployment counts, not by averaging the percentages of individual services. A service with many deployments therefore has more influence on the result than one with only a few.
Change Failure Rate graphs #
Each graph type is introduced in “Metric graphs” in the Dora Metrics Guide. This section shows what each graph looks like for Change Failure Rate and how to read it.
Change Failure Rate Trend #
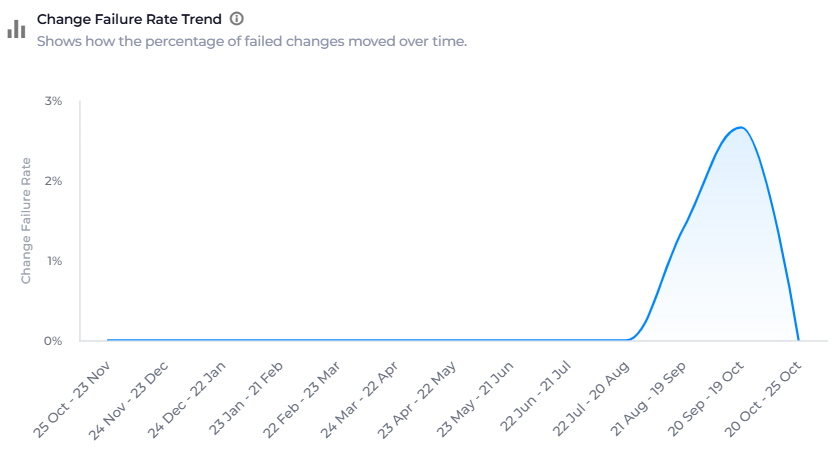
What it shows: How the percentage of failed changes moved over time. It highlights increases, decreases and recurring patterns in production changes that needed a hotfix or rollback.
Example: Over a 12-month period, Change Failure Rate stayed at 0% until July, rose to a peak of about 2.7% in 20 September–19 October, and dropped back to 0% in the last week.
Use it to: See whether releases are becoming more or less reliable, and spot periods with more failed changes.
Thresholds Legend #
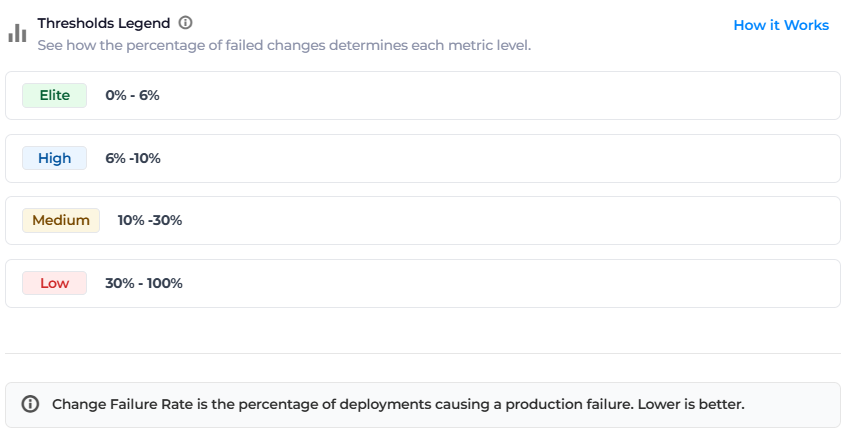
What it shows: The percentage thresholds that assign each level. Lower values represent more reliable release performance.
| Level | Change Failure Rate |
|---|---|
| Elite | 0% to 6% |
| High | 6% to 10% |
| Medium | 10% to 30% |
| Low | 30% to 100% |
Like Lead Time to Change, these thresholds are fixed. They do not change with the length of the selected period or the number of services.
Use it to: Know how far the failure rate needs to drop to move up a level.
Metal Rating Distribution #
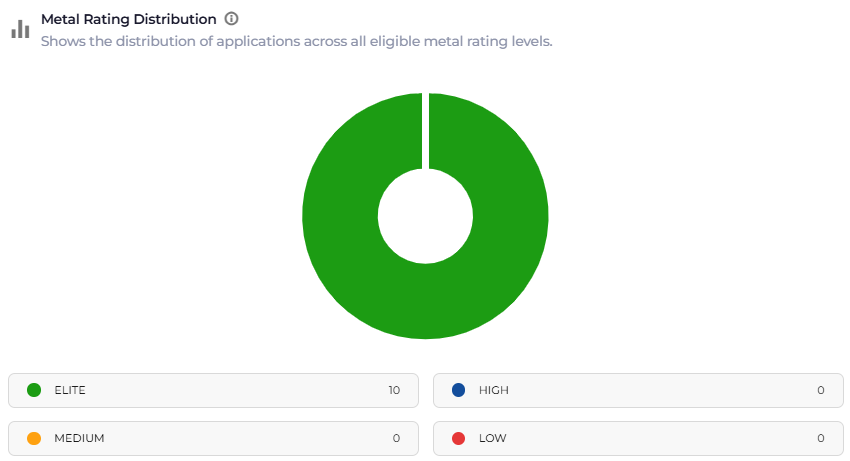
What it shows: How applications are spread across the Change Failure Rate levels.
Example: All 10 applications are Elite, so every application keeps its failure rate at 6% or below.
Use it to: Understand how release reliability is spread across your applications.
Applications Top Performing #
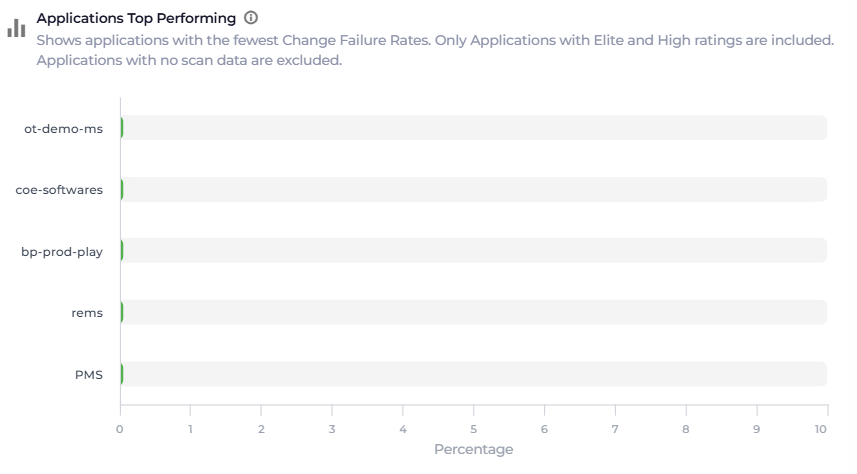
What it shows: The applications with the lowest percentage of valid deployments that needed a hotfix or rollback.
Example: ot-demo-ms, coe-softwares, bp-prod-play, rems and PMS all have a Change Failure Rate of 0%.
Use it to: Identify the applications with the most reliable releases and learn from their practices.
Change Failure Rate Contributors #
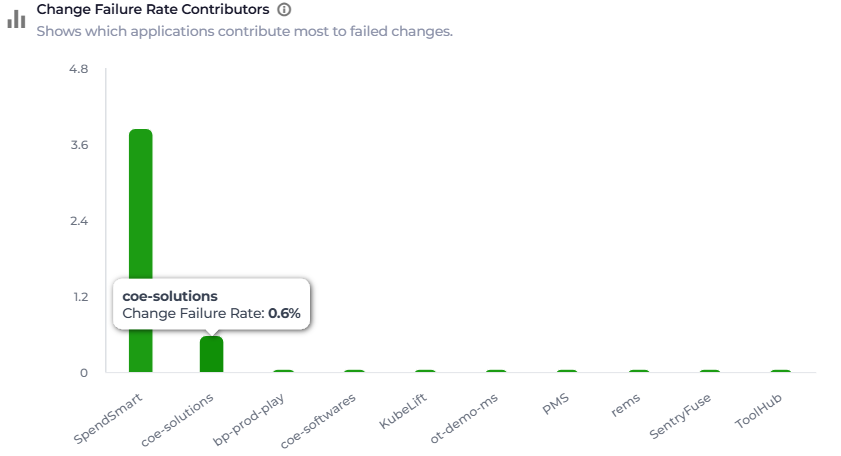
What it shows: The applications that contribute most to failed changes, that is, the applications with the greatest contribution to the overall Change Failure Rate during the selected period. Hover over a bar to see the application’s Change Failure Rate.
Example: SpendSmart contributes the most, at about 3.9%, followed by coe-solutions at 0.6%. The other applications contribute almost nothing.
Use it to: Find the few applications behind most failed changes, and focus reliability work there.