

Kubernetes Resources Overview #
BuildPiper shows the state of key Kubernetes resources inside the platform. You can monitor, check health and troubleshoot from the BuildPiper UI, without switching to Kubernetes tools such as kubectl or Lens. These views are read-only.
| View | What you can see |
|---|---|
| Cluster Nodes | Node status, labels, node type and readiness. |
| Namespaces | Namespace status, quotas, CPU and memory usage, and the raw YAML configuration. |
| Pods | Pod namespace, node placement, labels, status, duration, probes, restarts and volume mounts. |
Note: Admin privileges are required to access these views.
Navigation #
Open a cluster in BuildPiper, and use the left panel to reach the Nodes, Namespaces and Pods views.
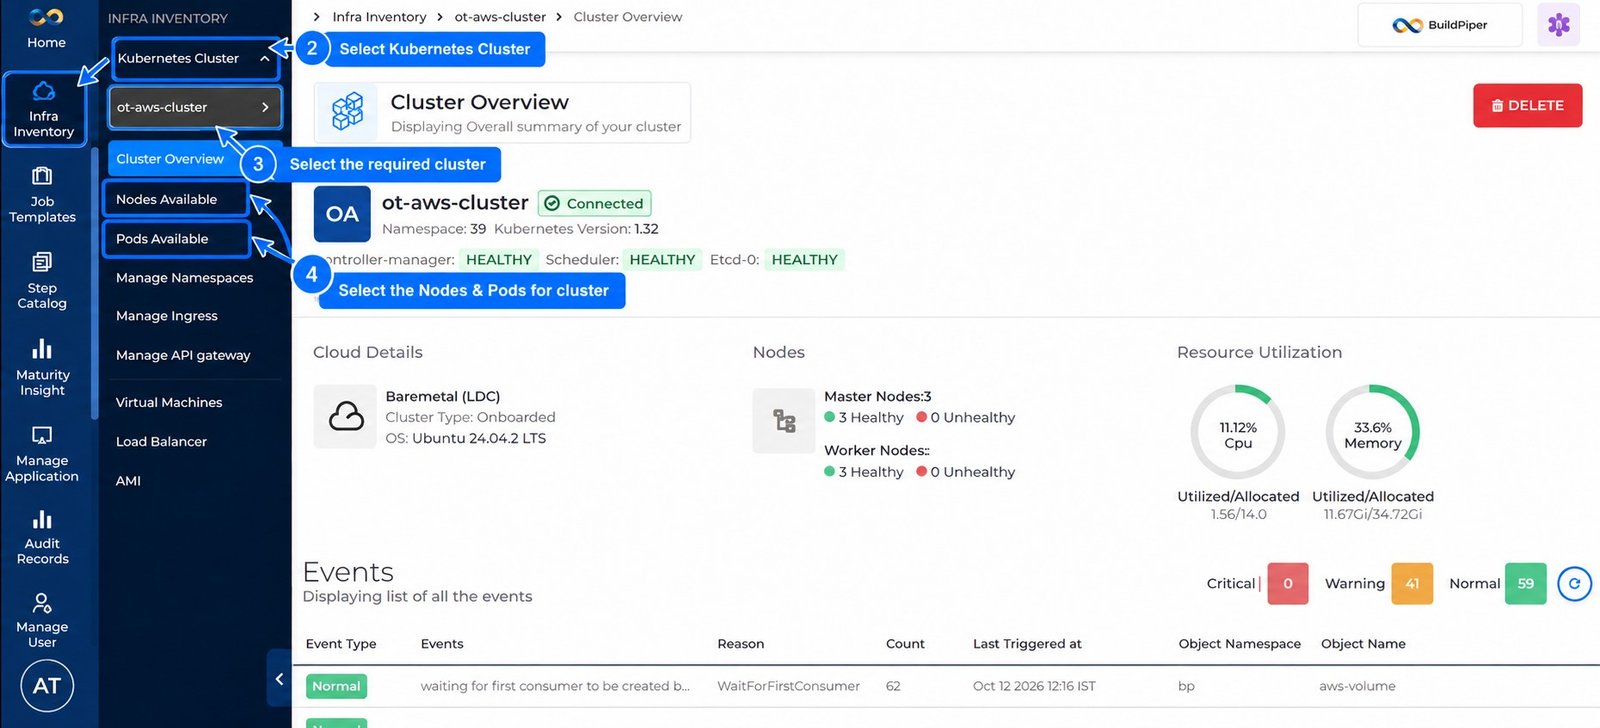
Figure 1: Navigation to Nodes Available and Pods Available
- 1
Login to BuildPiper and click Infra Inventory.
- 2
Select Kubernetes Cluster.
- 3
Select the required cluster. The Cluster Overview page opens.
- 4
In the left panel, select Nodes Available, Pods Available or Manage Namespaces.
1. Cluster Nodes #
BuildPiper gives a real-time view of all the nodes in your cluster, and shows whether each node is Ready or Not Ready. You can also review key details such as node status, labels and node type.
To open this view, click Nodes Available in the left panel.
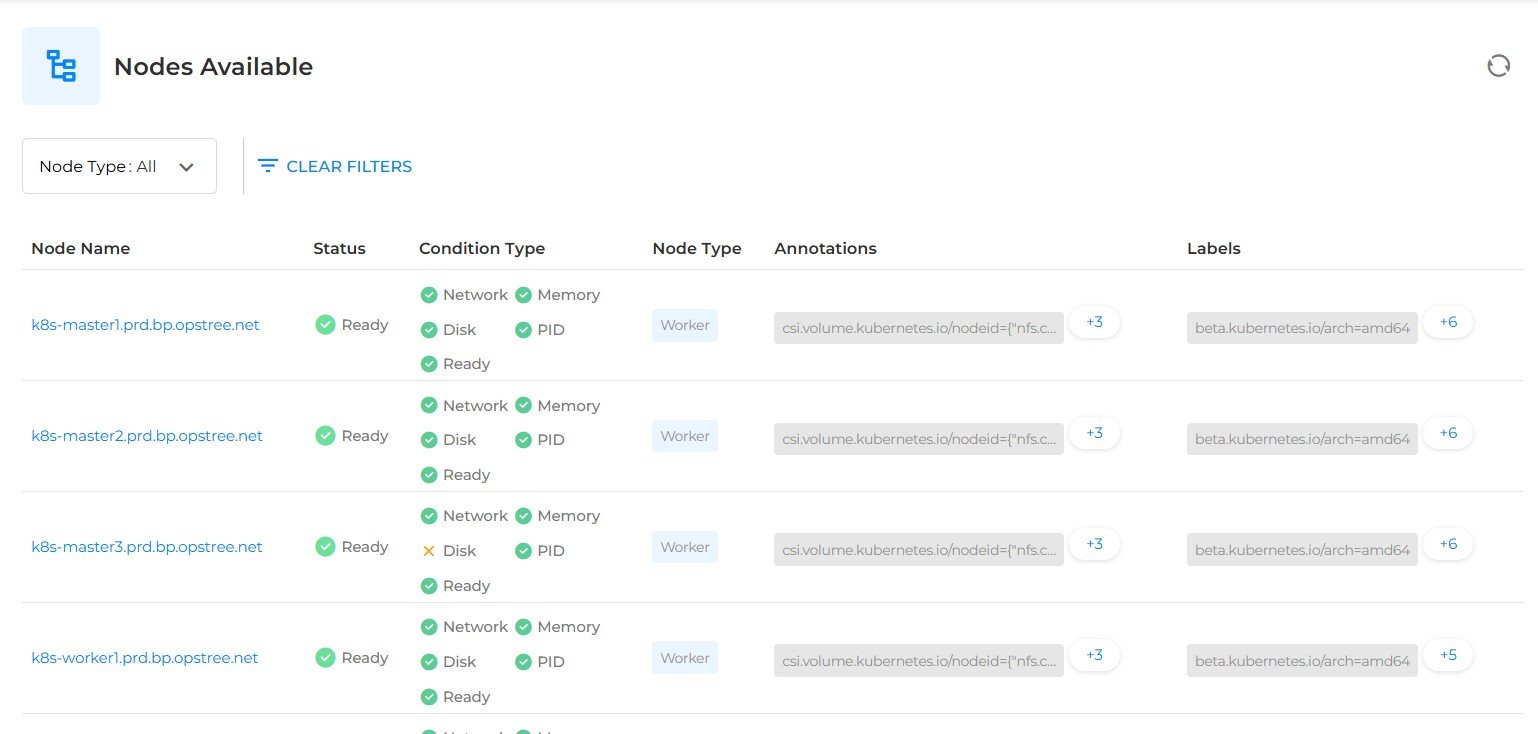
Figure 2: Nodes Available page
| Column | Description |
|---|---|
| Node Name | Name of the node. |
| Status | Whether the node is Ready or Not Ready. |
| Condition Type | Condition checks of the node: Network, Memory, Disk, PID and Ready. A green tick means the check is fine, and a cross means it has a problem. |
| Node Type | Type of the node. |
| Annotations | Annotations of the node. Click the +number to see the rest. |
| Labels | Labels of the node. Click the +number to see the rest. |
Use the Node Type filter to show nodes of one type, and CLEAR FILTERS to reset it. The refresh icon at the top right reloads the list.
1.1 Node Details #
Click a node name in the list to open the details of that node. The page shows the node name and the date it was created.
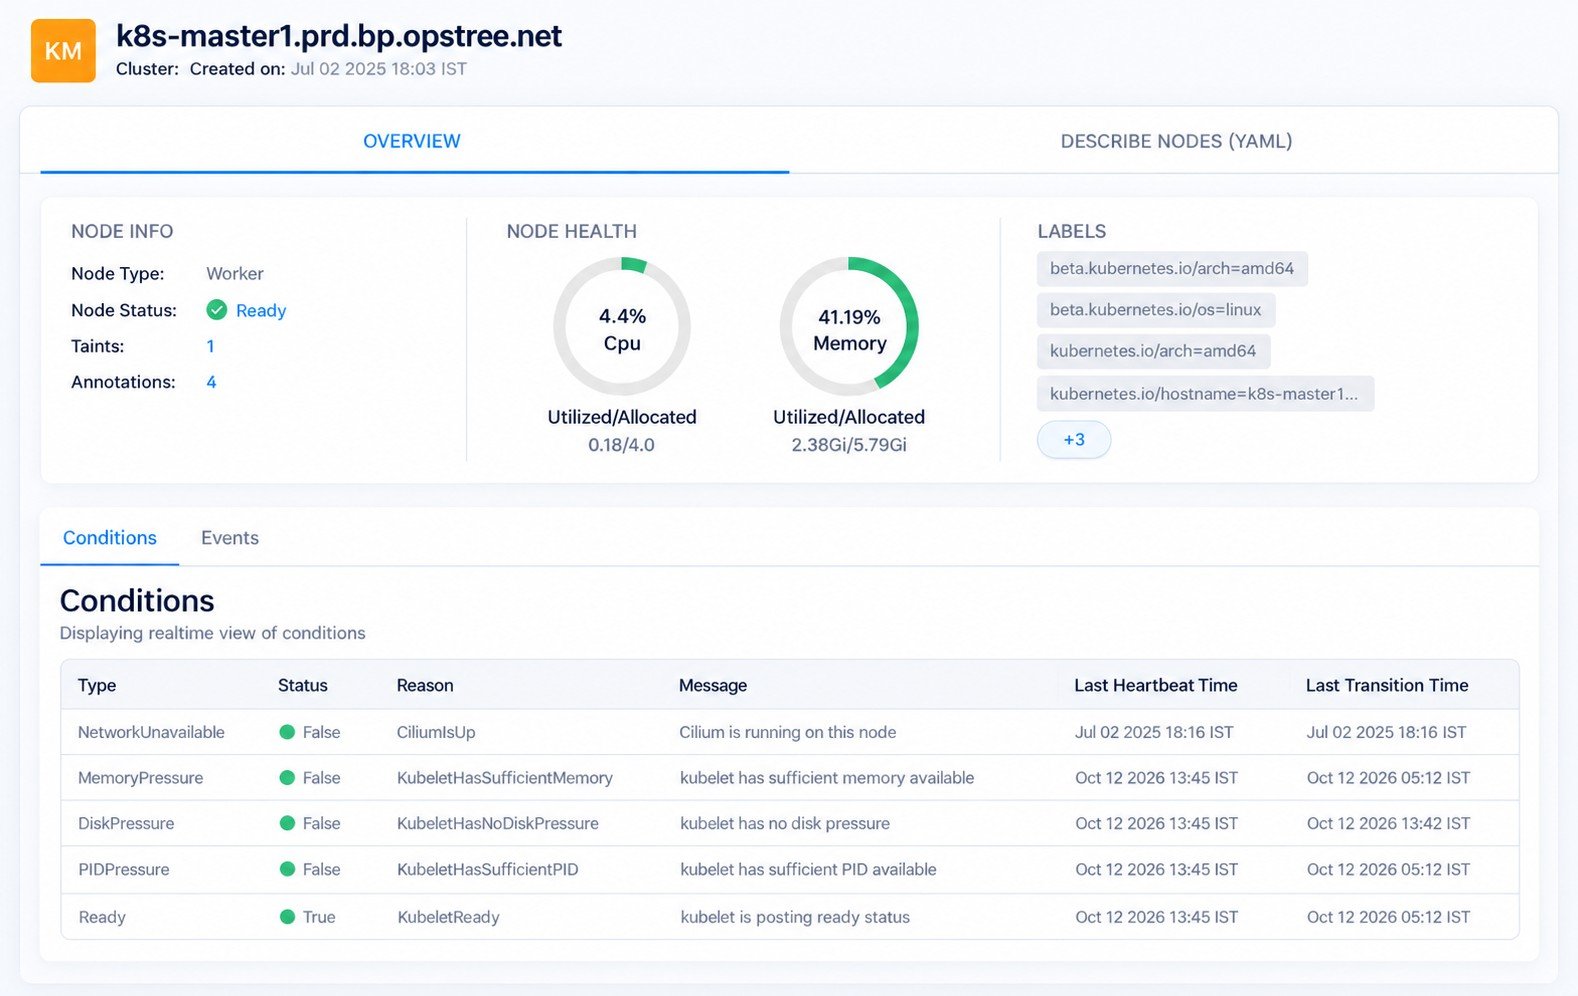
Figure 3: Node details
| Section | Description |
|---|---|
| OVERVIEW tab | Node Info, Node Health and Labels of the node (see below). |
| DESCRIBE NODES (YAML) tab | The node description in YAML format. |
| Overview Item | Description |
|---|---|
| Node Info | Node Type, Node Status (for example Ready), number of Taints and number of Annotations. |
| Node Health | CPU and memory use of the node, as a percentage, with the Utilized / Allocated values. |
| Labels | Labels of the node. Click the +number to see the rest. |
| Conditions tab | Real-time view of the node conditions. Columns: Type, Status, Reason, Message, Last Heartbeat Time and Last Transition Time. The conditions are NetworkUnavailable, MemoryPressure, DiskPressure, PIDPressure and Ready. |
| Events tab | Events of the node. |
2. Namespaces #
BuildPiper gives one view of all the namespaces in the cluster, with the status of each namespace, its resource quotas, and the current CPU and memory usage. To open this view, click Manage Namespaces in the left panel.
Read more: Namespace: view, manage and edit namespaces in a cluster
3. Pods #
BuildPiper connects directly to the Kubernetes cluster and shows live data. The Pods view maps the workload of the cluster. It shows the namespace and the node where each pod is scheduled, along with its labels, current status and how long it has been running.
| Feature | Description |
|---|---|
| Pod Diagnostics | Drill down into liveness and readiness probe states, restart counts and volume mount details. |
| Live Operational State | Move from the high-level list of pods to a detailed check of pod health and usage. |
To open this view, click Pods Available in the left panel.
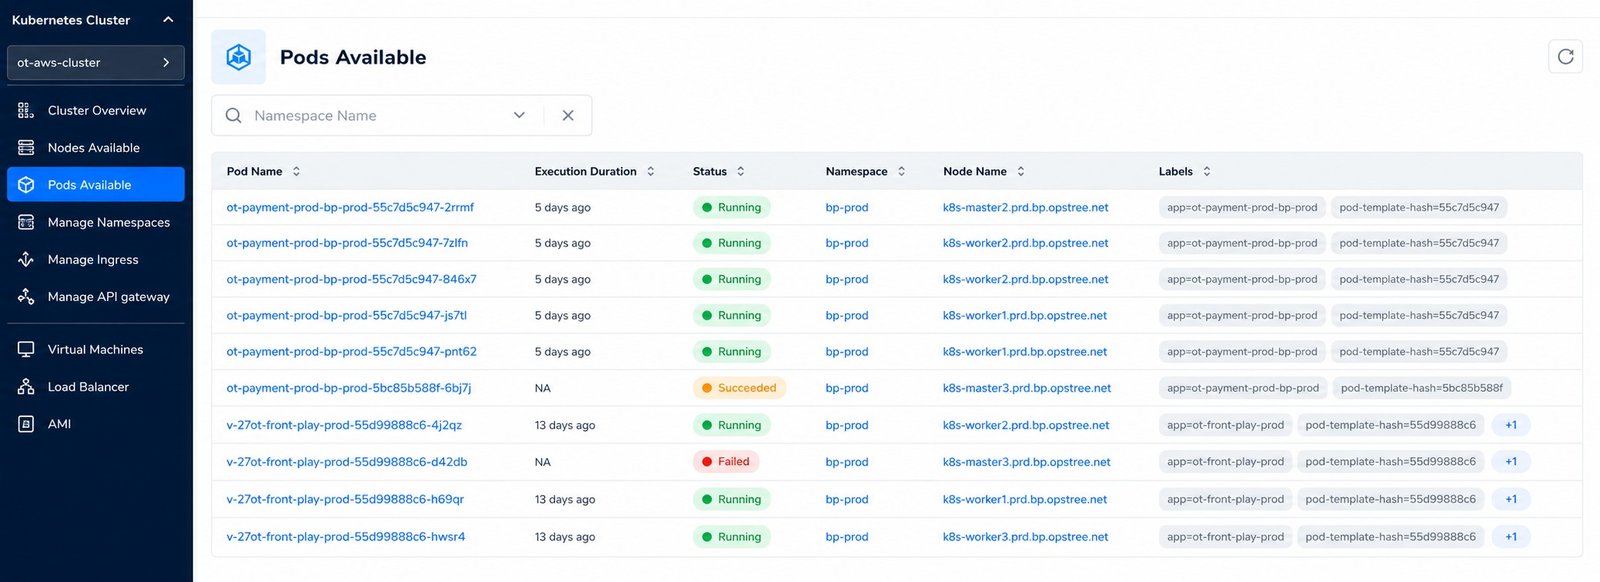
Figure 4: Pods Available page
| Column | Description |
|---|---|
| Pod Name | Name of the pod. |
| Execution Duration | How long the pod has been running, for example 5 days ago. |
| Status | Current status of the pod, for example Running, Succeeded or Failed. |
| Namespace | Namespace where the pod is scheduled. |
| Node Name | Node where the pod is scheduled. |
| Labels | Labels of the pod. Click the +number to see the rest. |
Use the Namespace Name filter to show the pods of one namespace. You can sort the list with the arrows in the column headings, and the refresh icon at the top right reloads the list.
3.1 Pod Details #
Click a pod name in the list to open the details of that pod. The page shows the pod name, its cluster and its namespace.
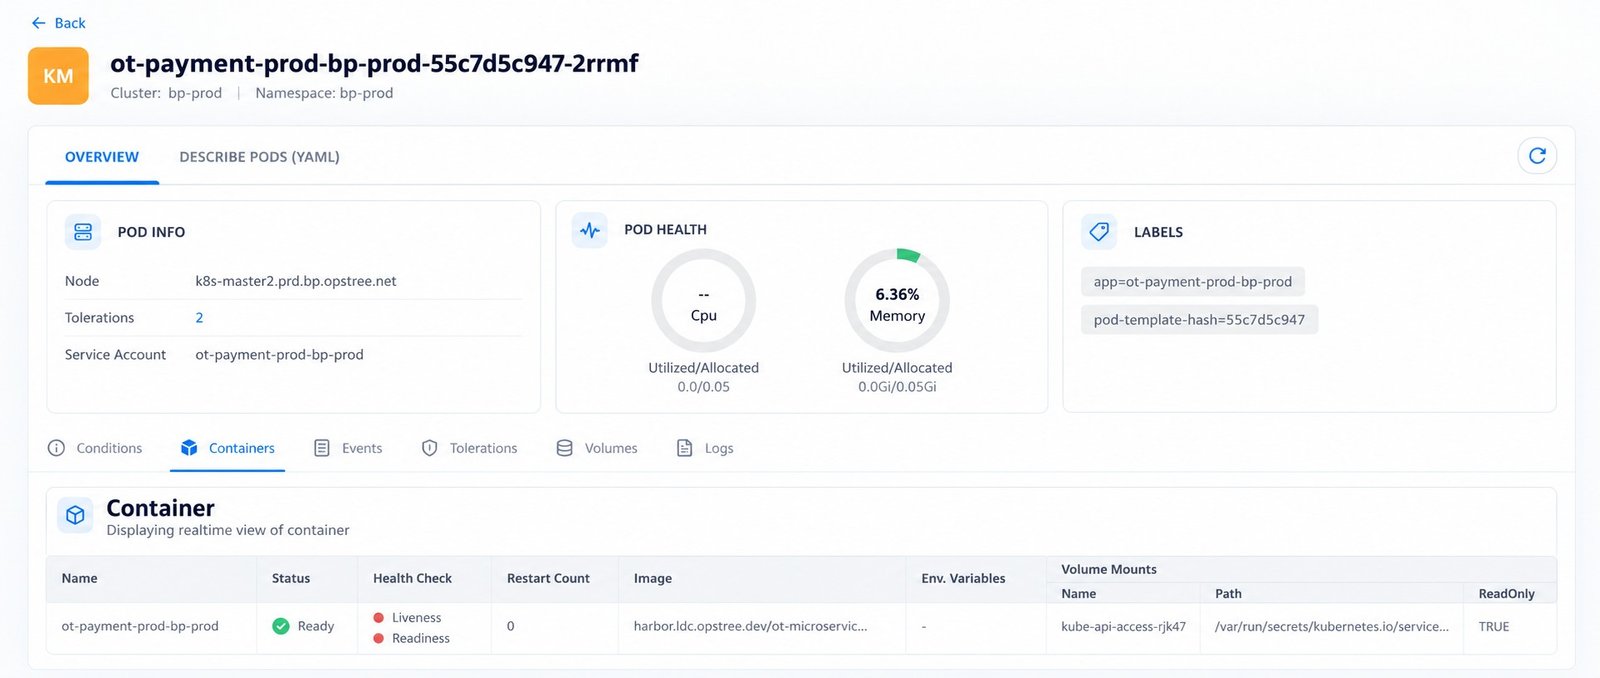
Figure 5: Pod details
| Section | Description |
|---|---|
| OVERVIEW tab | Pod Info, Pod Health and Labels of the pod, and the detail tabs below them. |
| DESCRIBE PODS (YAML) tab | The pod description in YAML format. |
| Pod Info | The node where the pod runs, the number of Tolerations and the Service Account. |
| Pod Health | CPU and memory use of the pod, with the Utilized / Allocated values. |
| Labels | Labels of the pod. |
Below the overview are the tabs Conditions, Containers, Events, Tolerations, Volumes and Logs. The Containers tab shows a real-time view of the containers in the pod:
| Container Column | Description |
|---|---|
| Name | Name of the container. |
| Status | Status of the container, for example Ready. |
| Health Check | State of the Liveness and Readiness probes. |
| Restart Count | Number of times the container has restarted. |
| Image | Image used by the container. |
| Env. Variables | Environment variables of the container. |
| Volume Mounts | Volume mounts of the container, with the Name, Path and ReadOnly value. |